TBA Internship 2019
Web based Charting Engine
Topic: Implement a web-based dashboard for our KPI (Key Performance Indicator) tool.
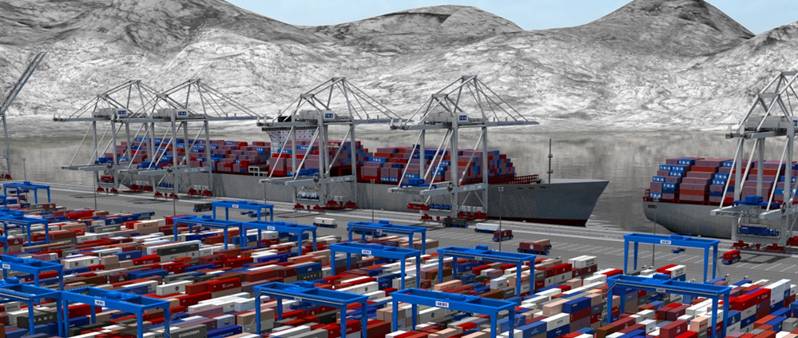
What is it: We have a product (KPI) that is able to analyse the processes of the terminal, giving precise information regarding productivities of the equipments and processes.
Technologies: HTML, CSS, Angular/Vue, D3.js and possibly some Java for a simple backend work.
How we imagine this app:
- The user generates report results with KPI.
- KPI tool provides the results (numbers, table of numbers) to the app.
- The results are presented on nice user friendly, light weight charts, organized on a dashboard.
Vessel Structure Editor
Topic: Building a vessel structure editor
What is it: In our products we use vessel structures to describe how a vessel looks like. These structures are specified with a vessel structure editor.
Technologies: HTML, CSS, Angular/Vue, D3.js and possibly some NodeJS for a simple backend.
How we imagine this app:
- The user wants to create a new vessel structure using a graphical UI tool.
- The user first specifies how many 20ft bays, rows, ties your container vessel has.
- The app creates a rectangular bar structure representing the vessel’s bays as specified.
- Next the app allows the user to remove those bay locations (row, tier locations) that are not available in reality, so the users sculpts the final shape of the vessel.
- Next some bays can be merged into 40ft bays, a deck house can be added, and other parameters can be finetuned.
- Finally the result is stored in our vessel structure JSON data format.