Analogical complexes

—

—
| [(non-comedo);(PCT);(Pc T,Pc N)] [(comedo);(surgery,PCT);(Bio)] [(cribriform,comedo,alveo,non-comedo,paget);(PCT); (Bio)] [(comedo,alveo,cli);(surgery);(Bio)] [(comedo,non-comedo,coloidal,cribriform); (PCTneoadj); (Pc T)] [(comedo,cribriform);(PCT);(Pc T,Bio)] |
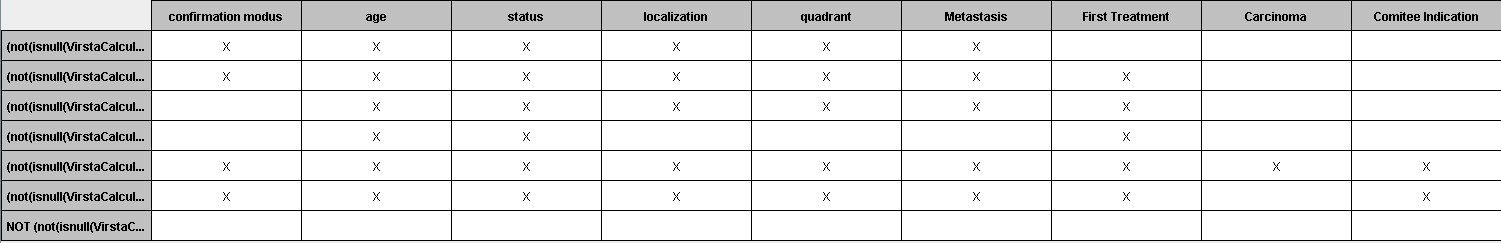
| Tricontext 1: Types of carcinoma (objects), First applied treatment (attributes), Confirmation Mode (conditions) |
|---|
| [(Pc T);(PCT);(cons,rad,nosurgery)] [(Pc T,Bio);(surgery,PCT);(cons)] [(Bio);(surgery,PCT);(rad)] [(Bio);(surgery,PCT);(cons, rad)] [(Pc T,Bio);(PCT);(cons, rad)] [(Pc T);(PCT,Meta);(rad)] [(Pc T,Bio,Pc N);(PCT);(rad)] |
| Tricontext 2: Confirmation Mode (objects), First applied treatment (attributes), Comitee indication (conditions) |
| [(liver);(A,DTX,T);(vomiting,nausea)] [(bone);(EC,CMF);(vomiting,alopecia,neutropenia,nausea)] [(pleurisy);(AC,TXT);(vomiting, alopecia, nausea)] [(lung);(AC); (edema, appendages, neutropenia, nausea)] |
| Tricontext 3: Location of Metastasis(objects), Treatment(attributes), Drug Adverse Reactions(conditions) |
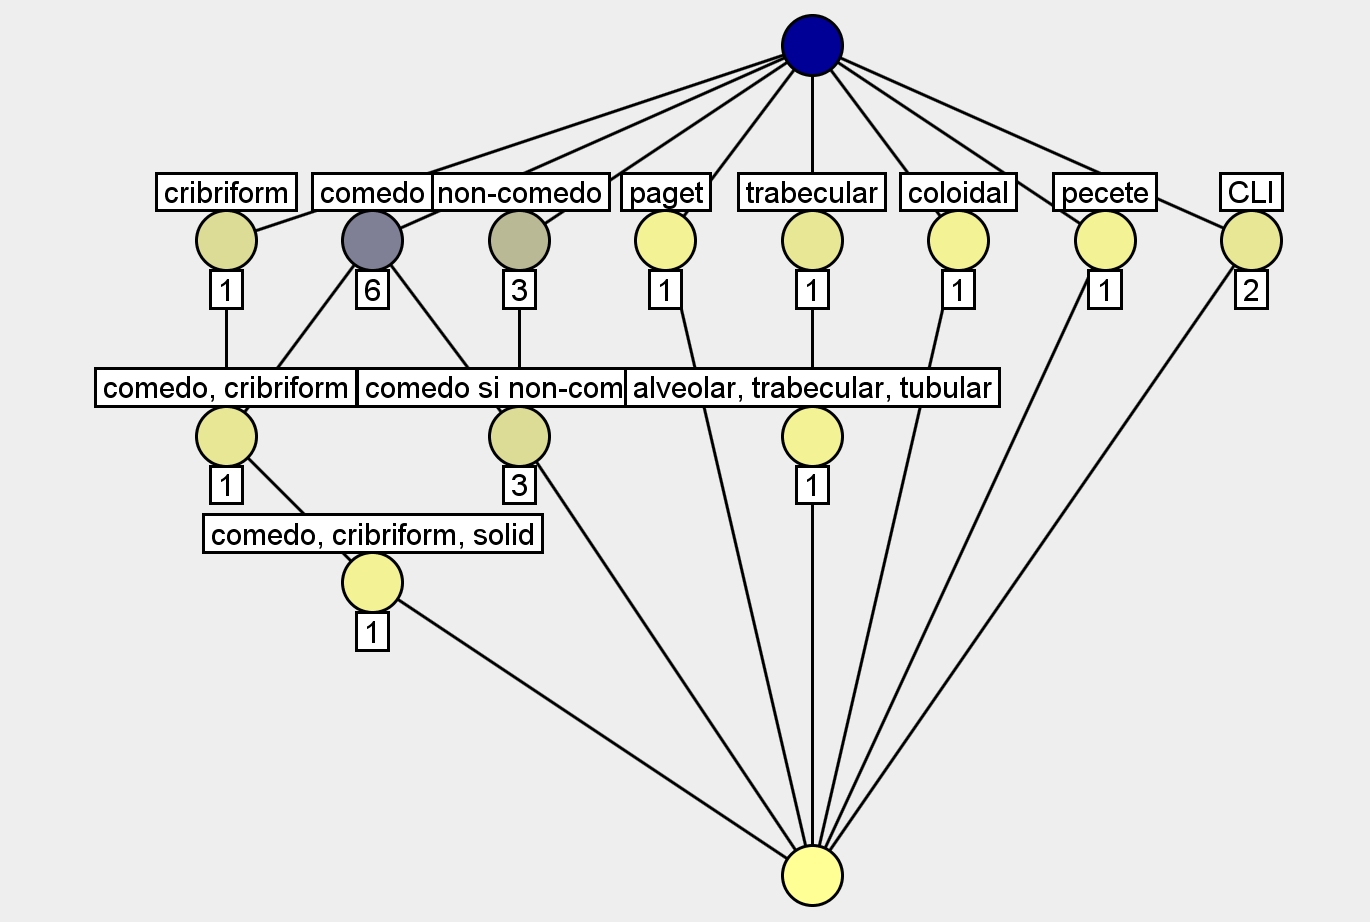 |
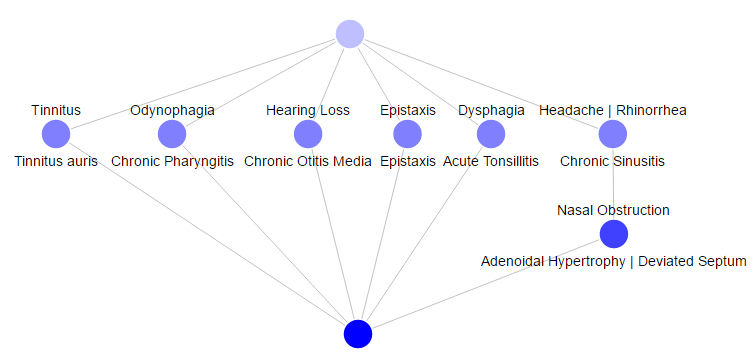
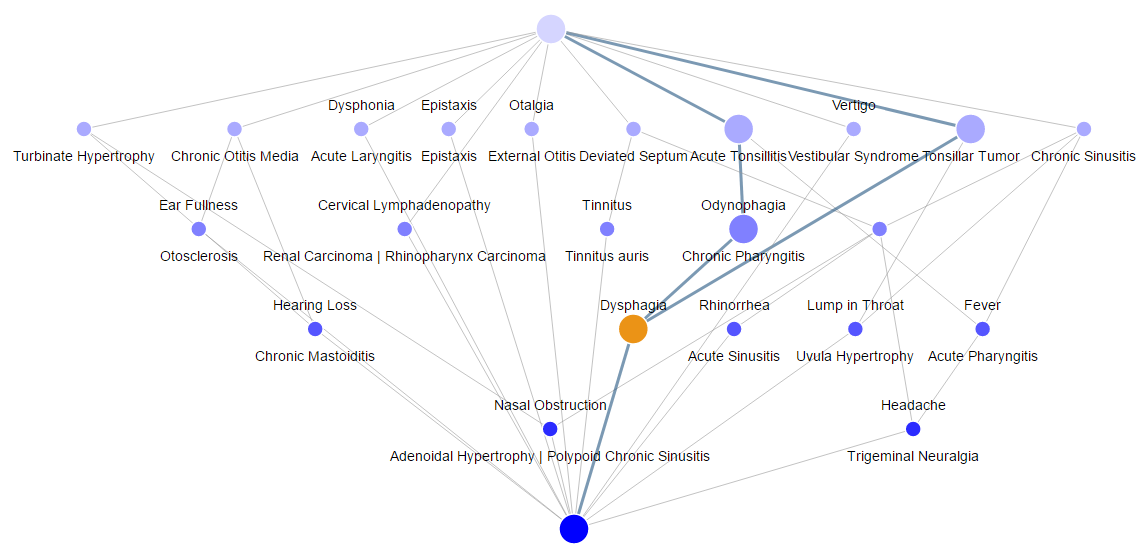
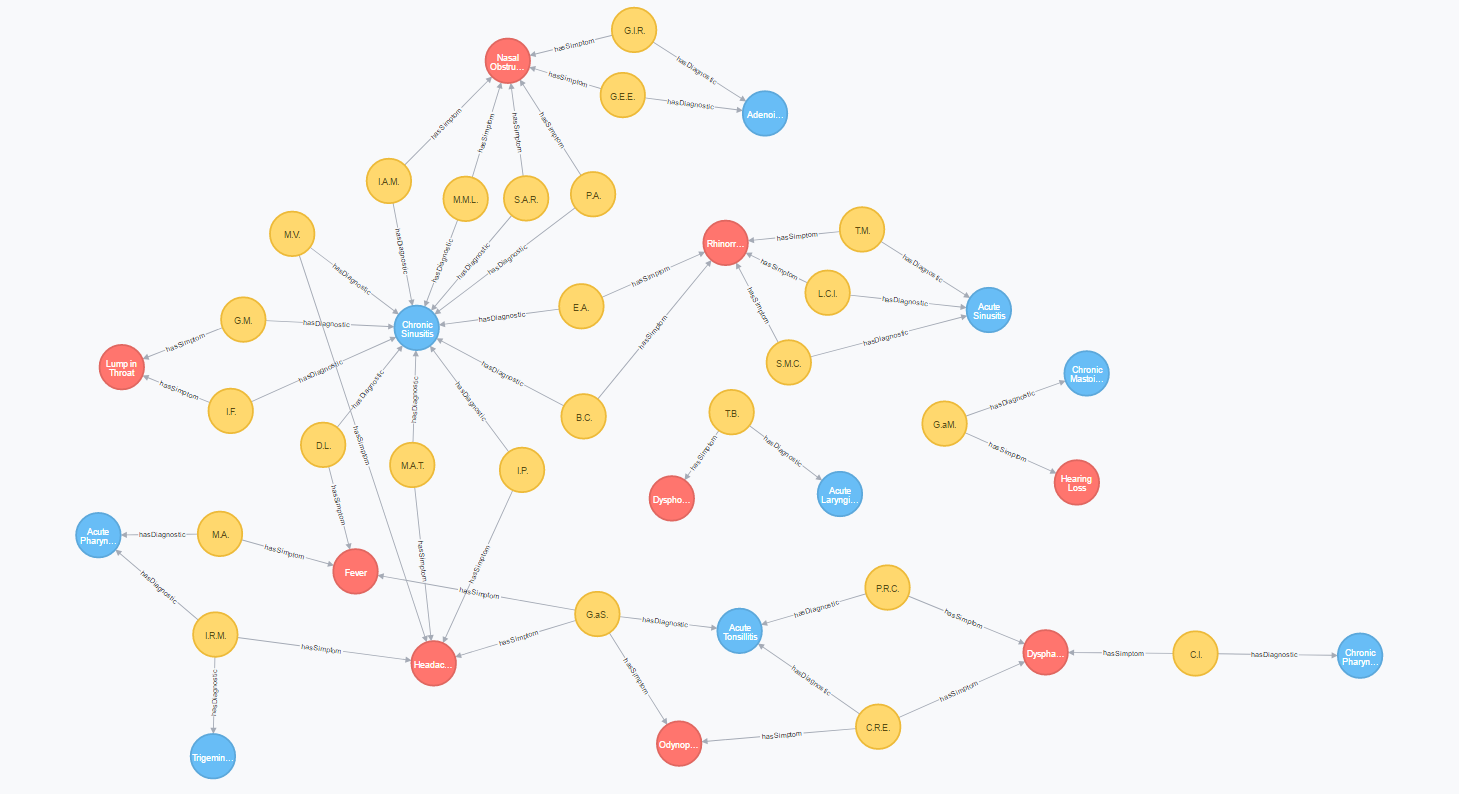
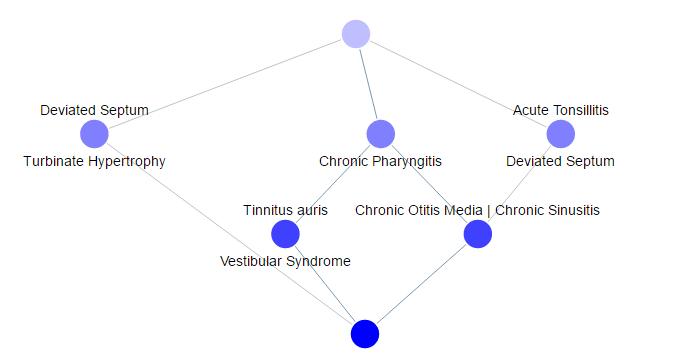
| Fig. 1. Carcinoma map |
|---|
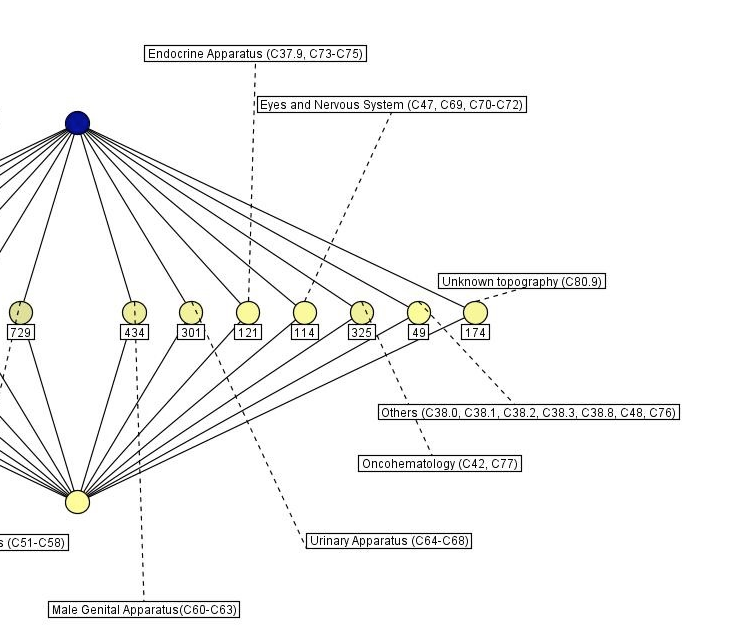 |
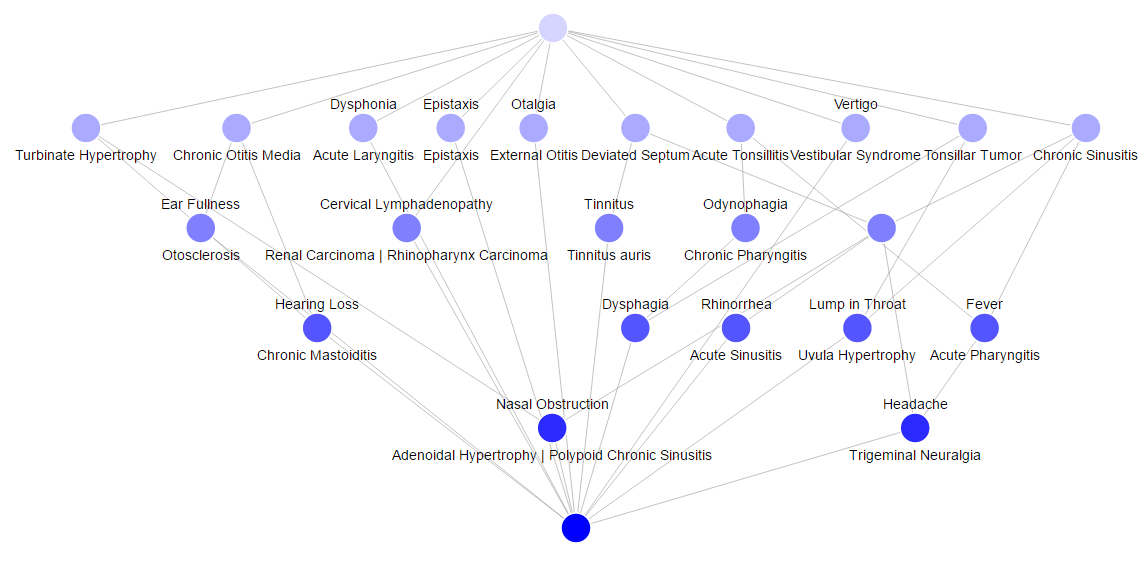
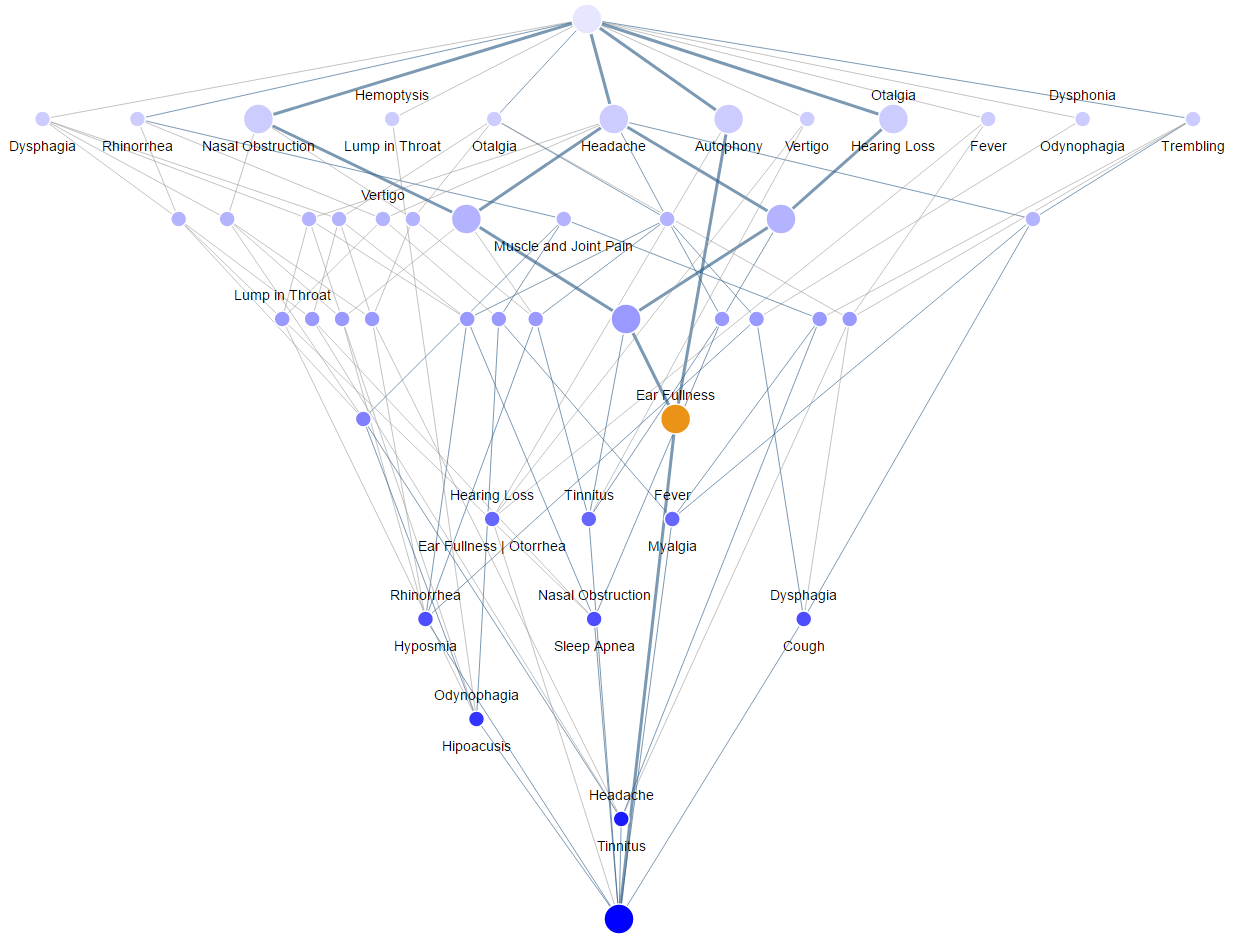
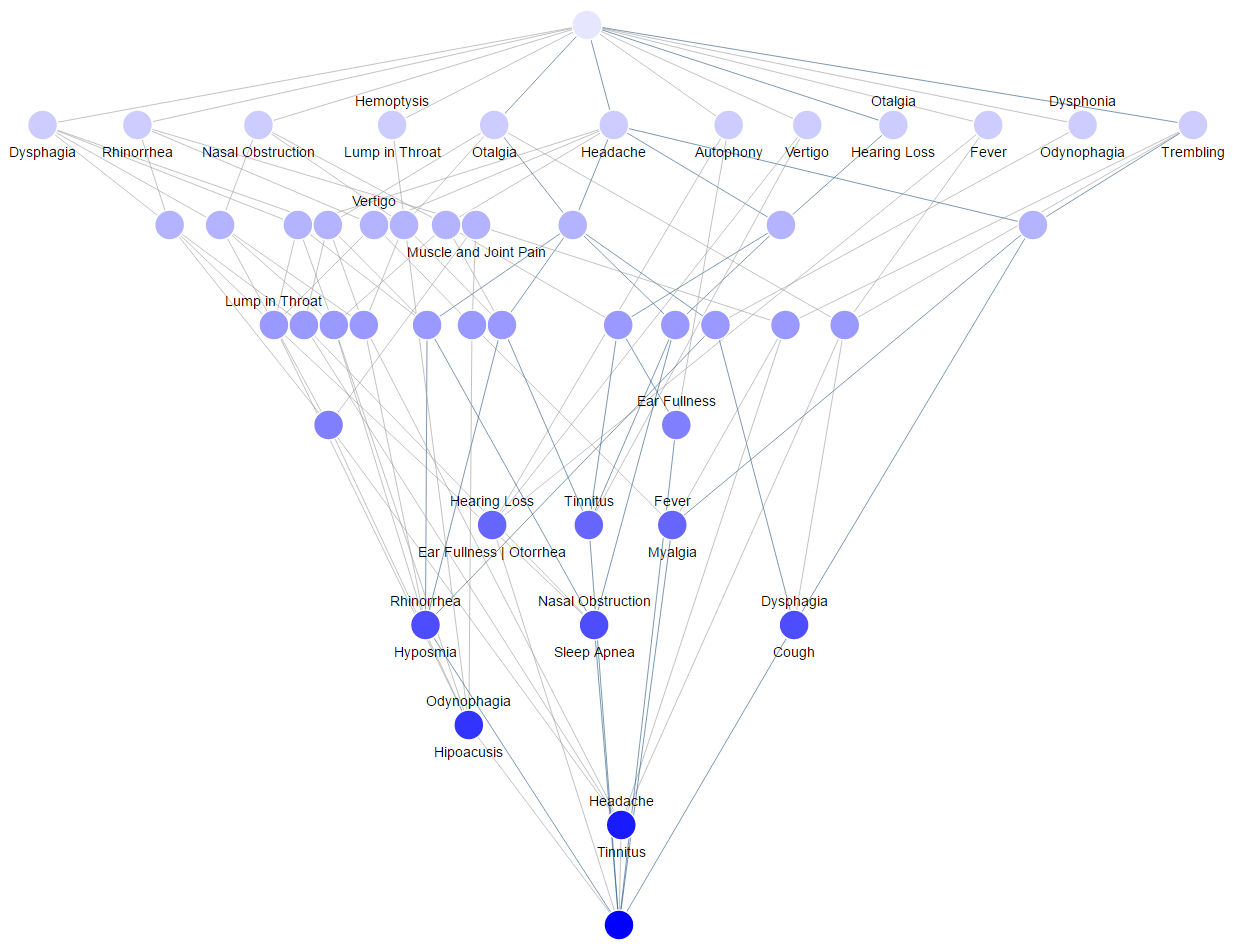
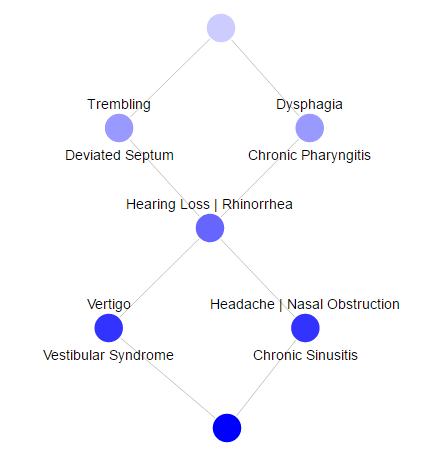
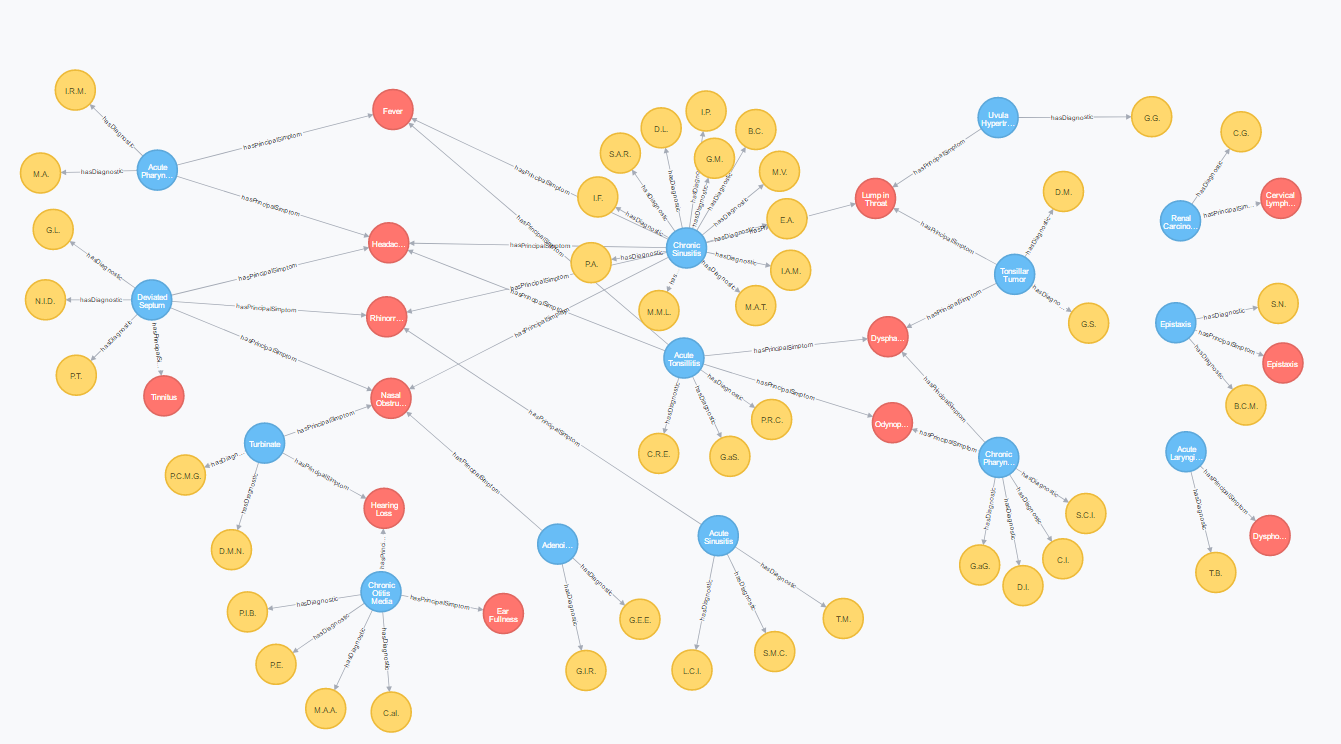
| Fig. 2. Cancer tumor topography. Partial view. |
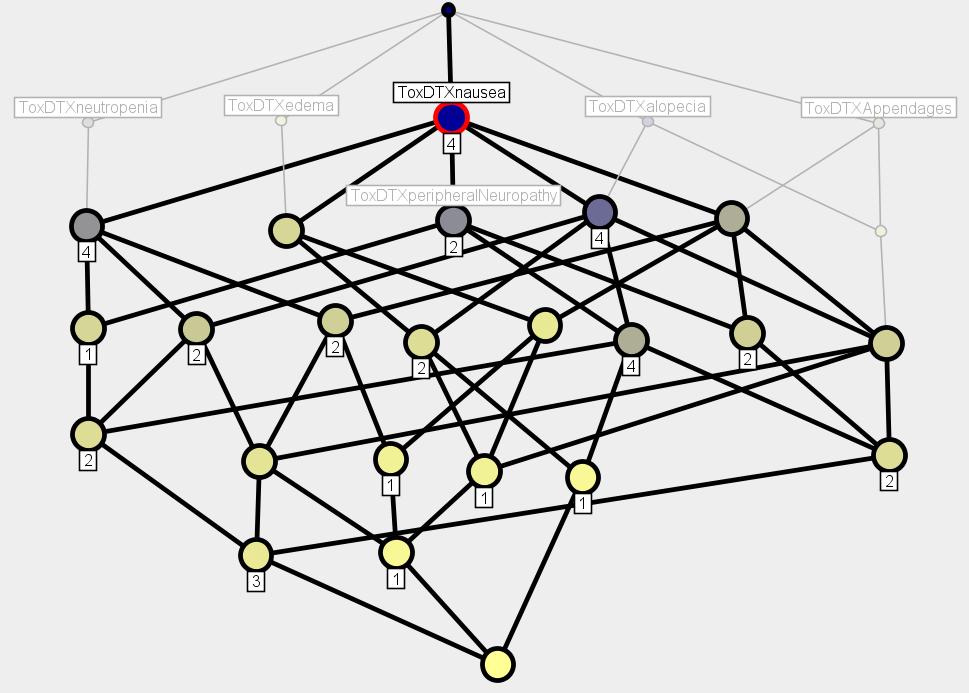 |
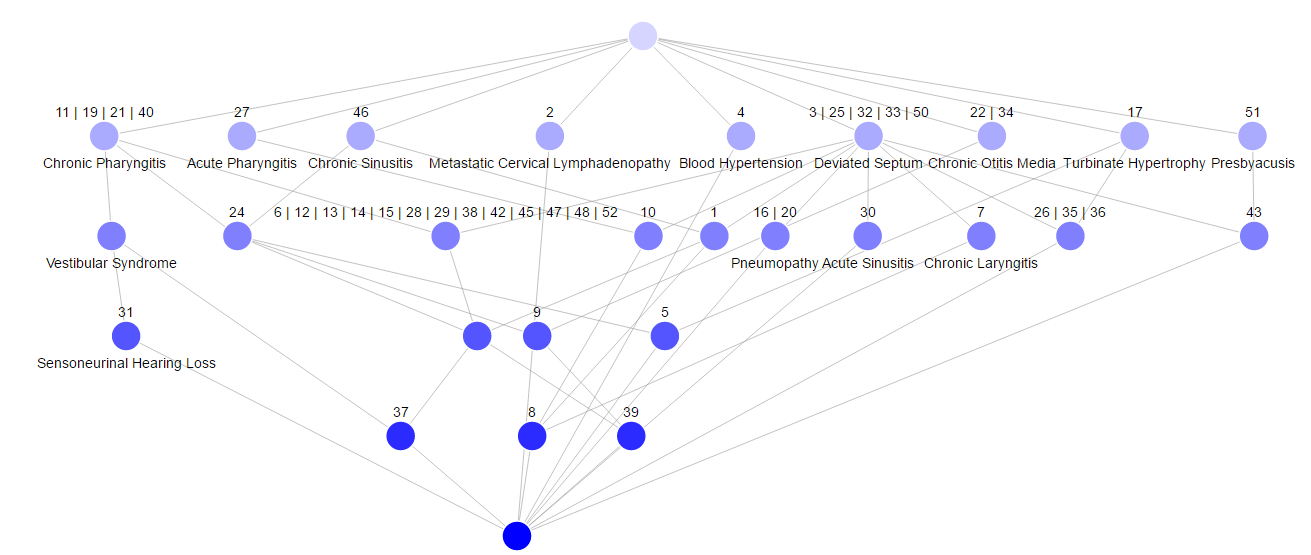
| Fig. 3. DTX adverse reactions: complete distribution view. The Nauseanode is selected, highlighting all combinations of adverse effects that includenausea. The results are in count format, showing the number of patients thathave suffered all the adverse effects determining a certain node. |
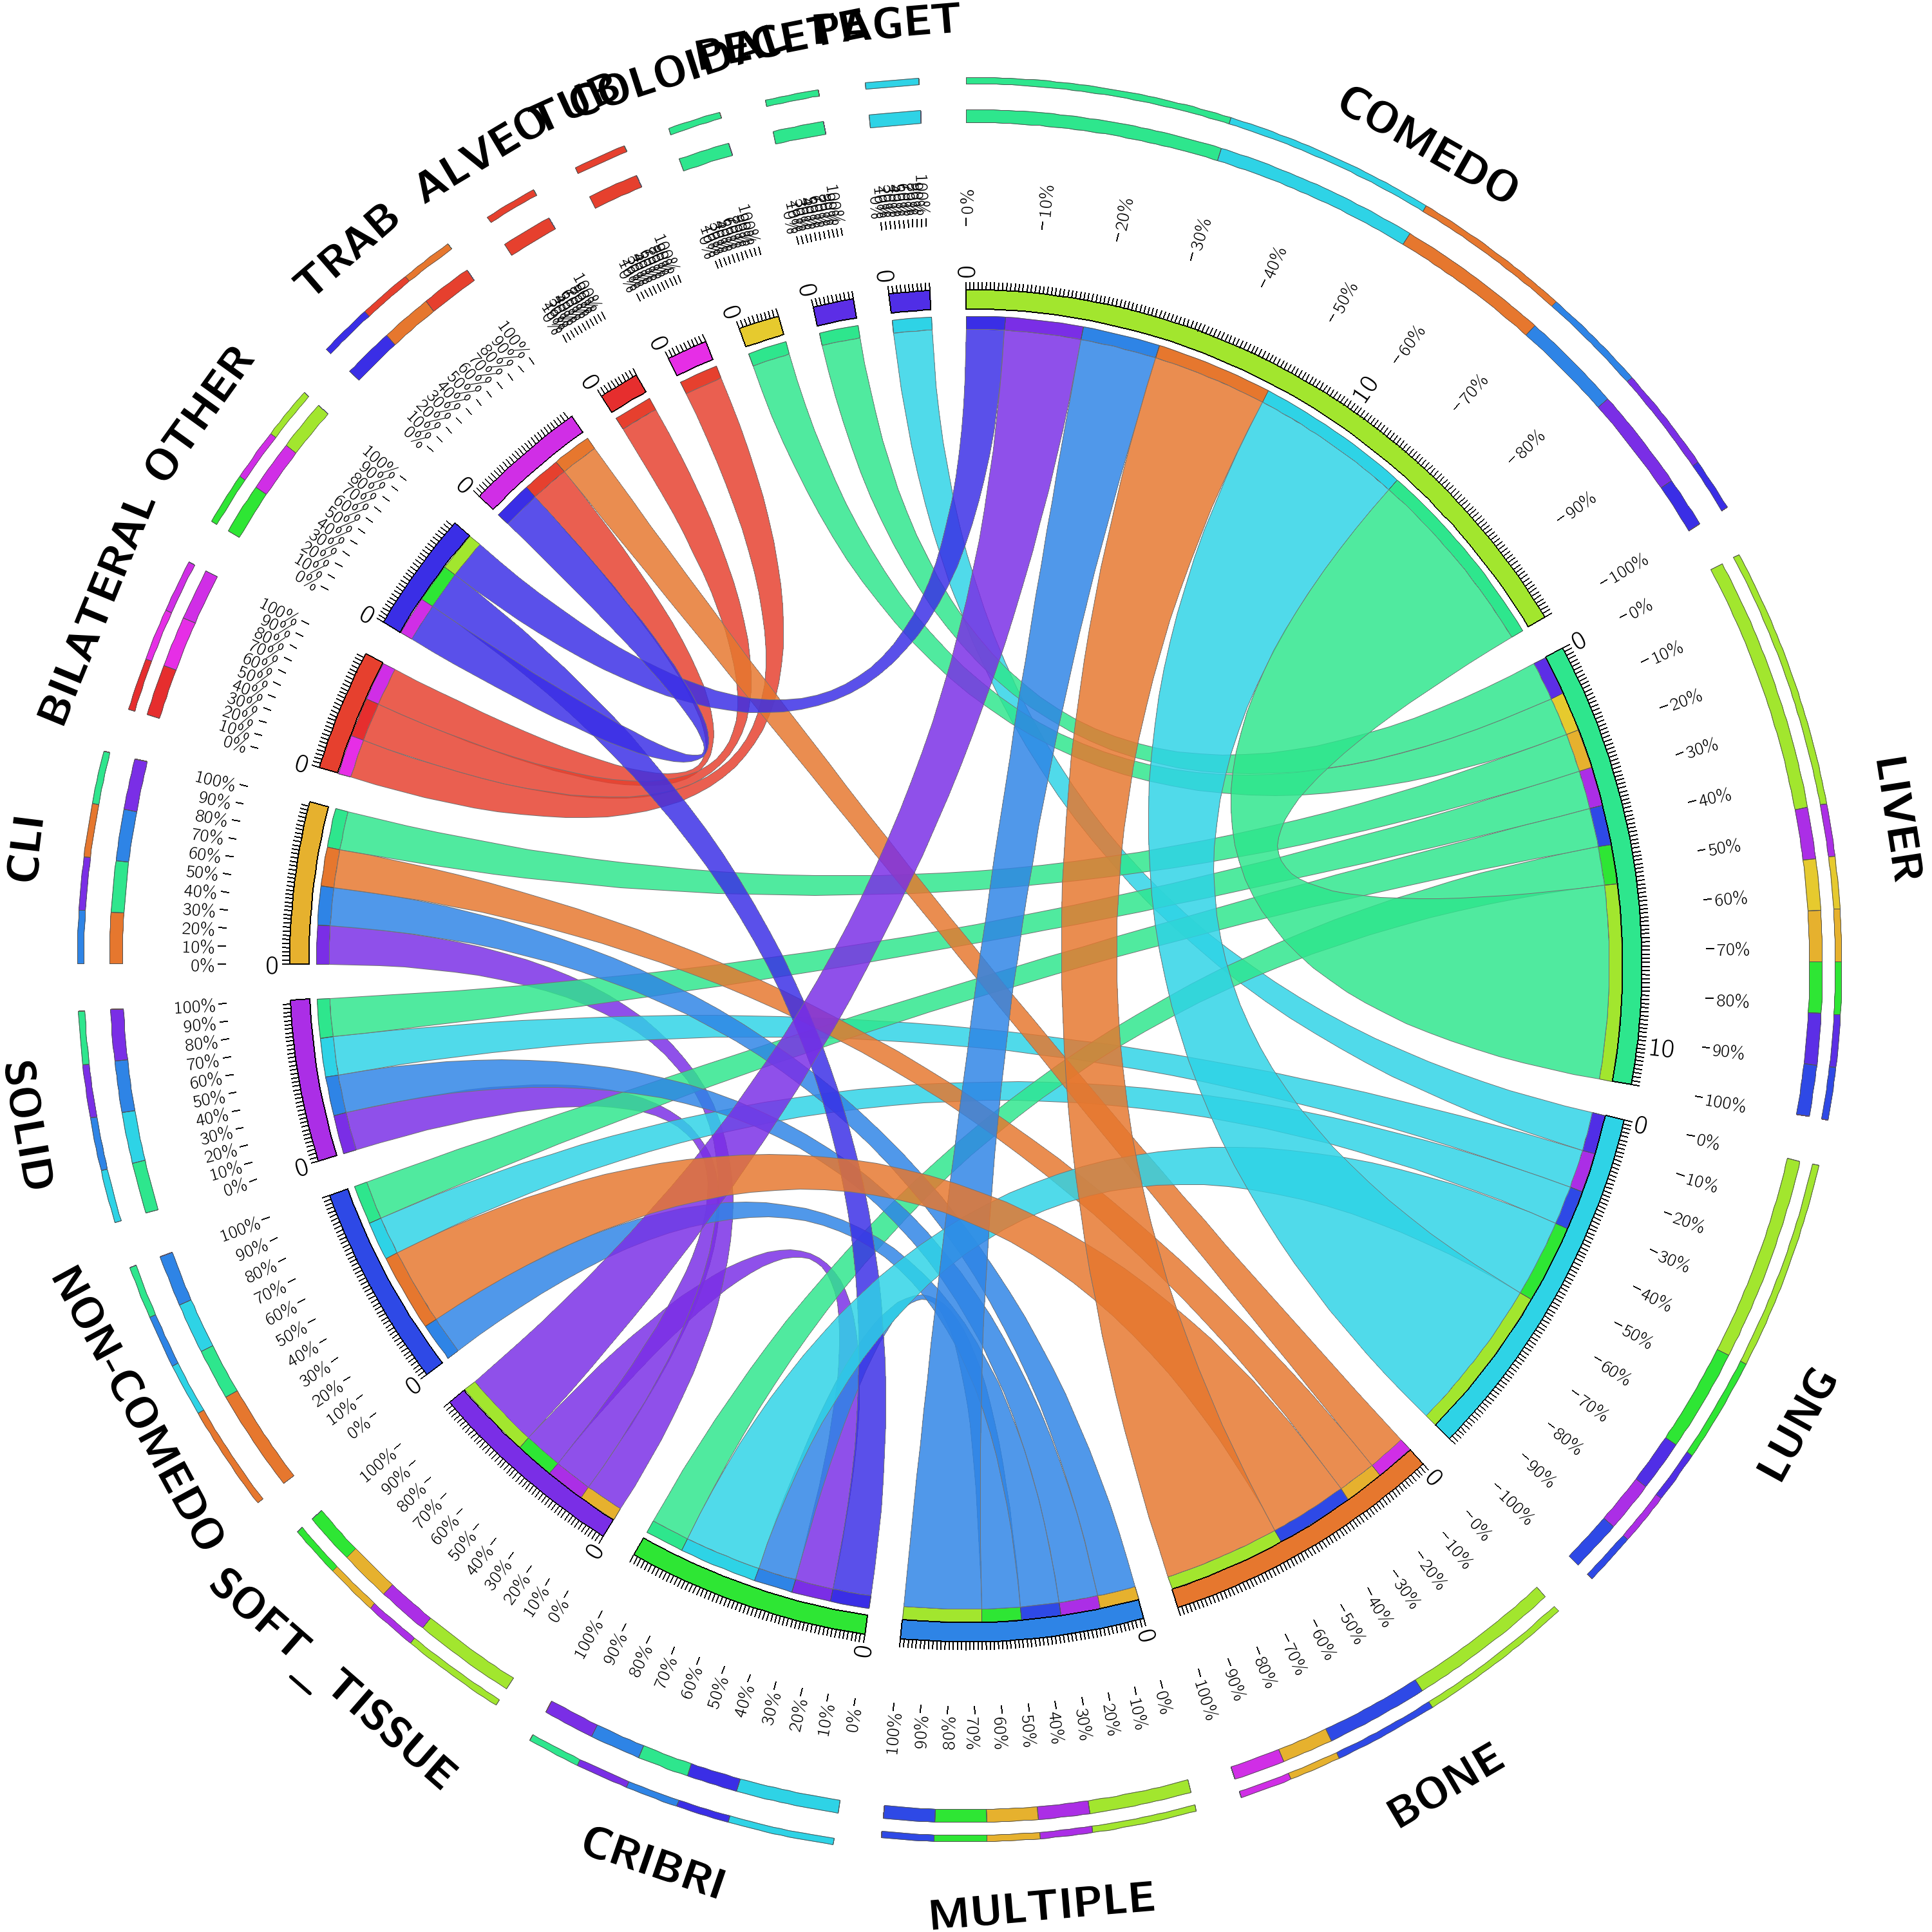 |
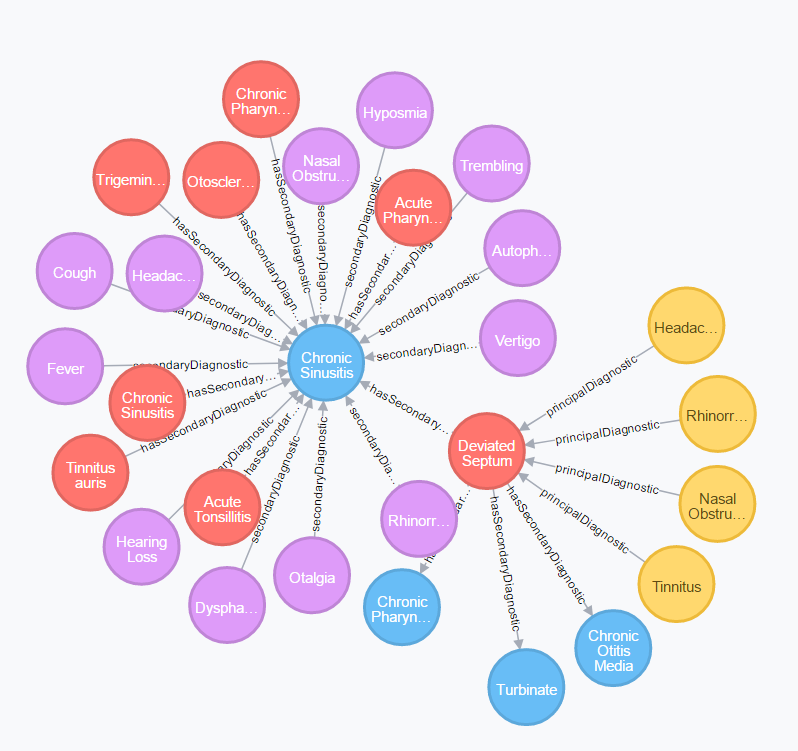
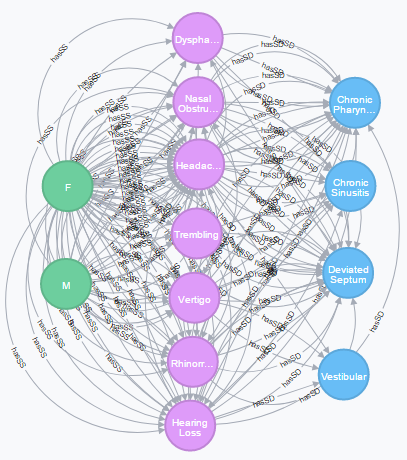
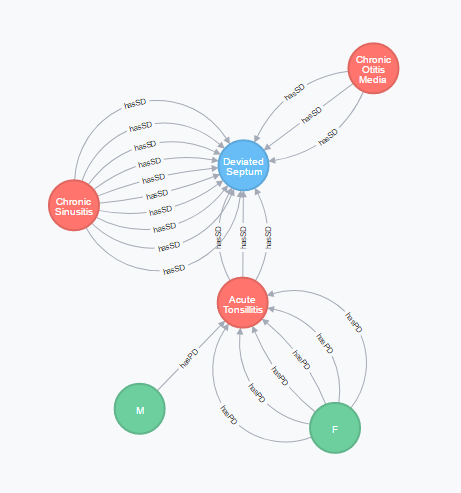
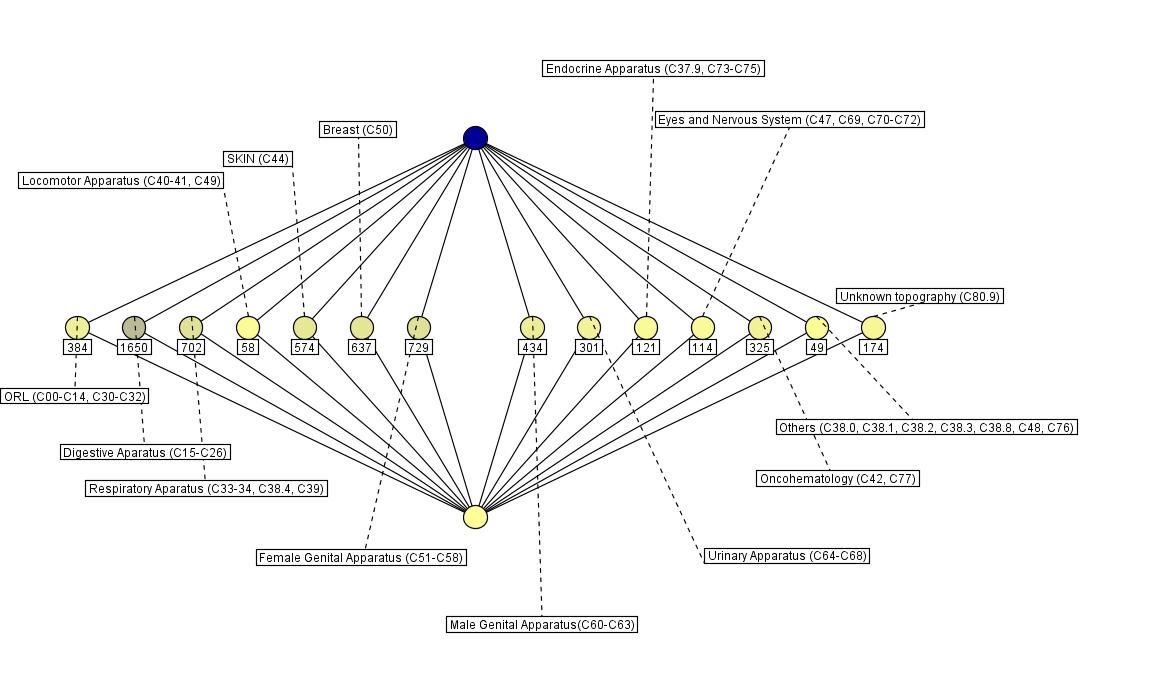
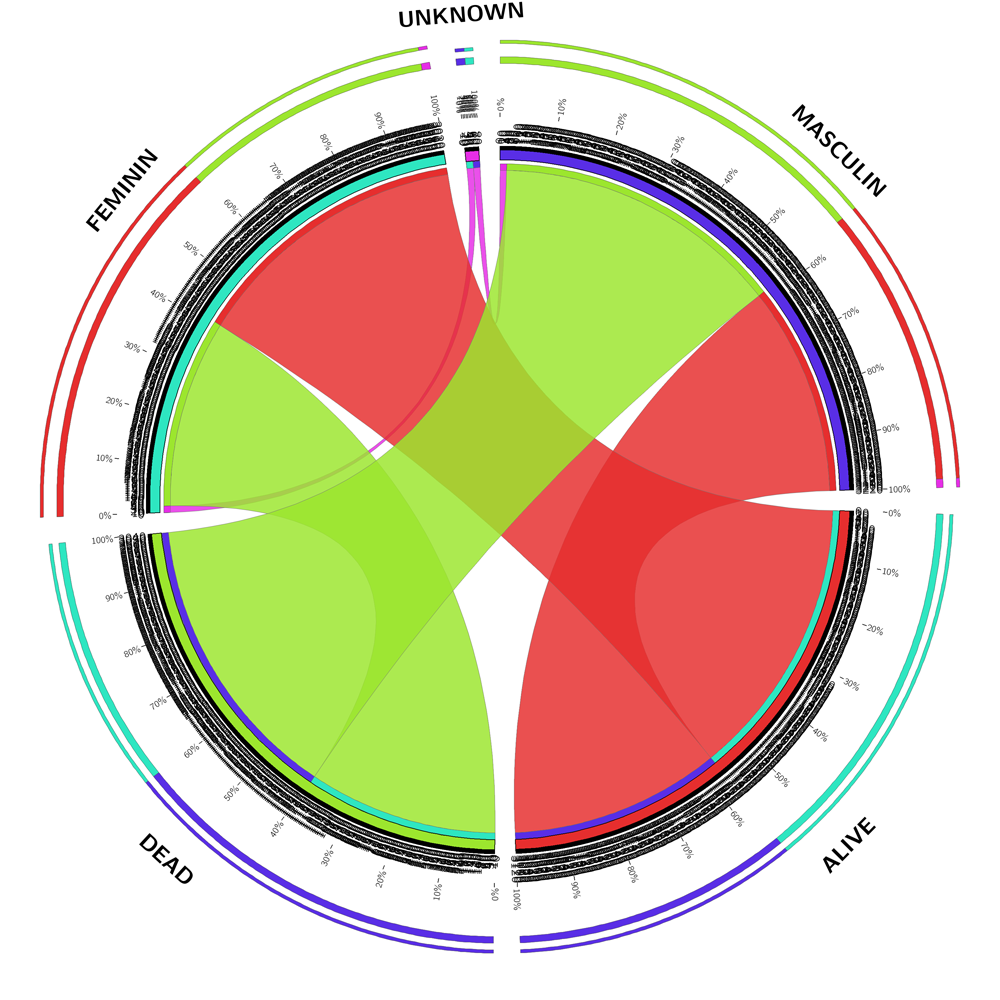
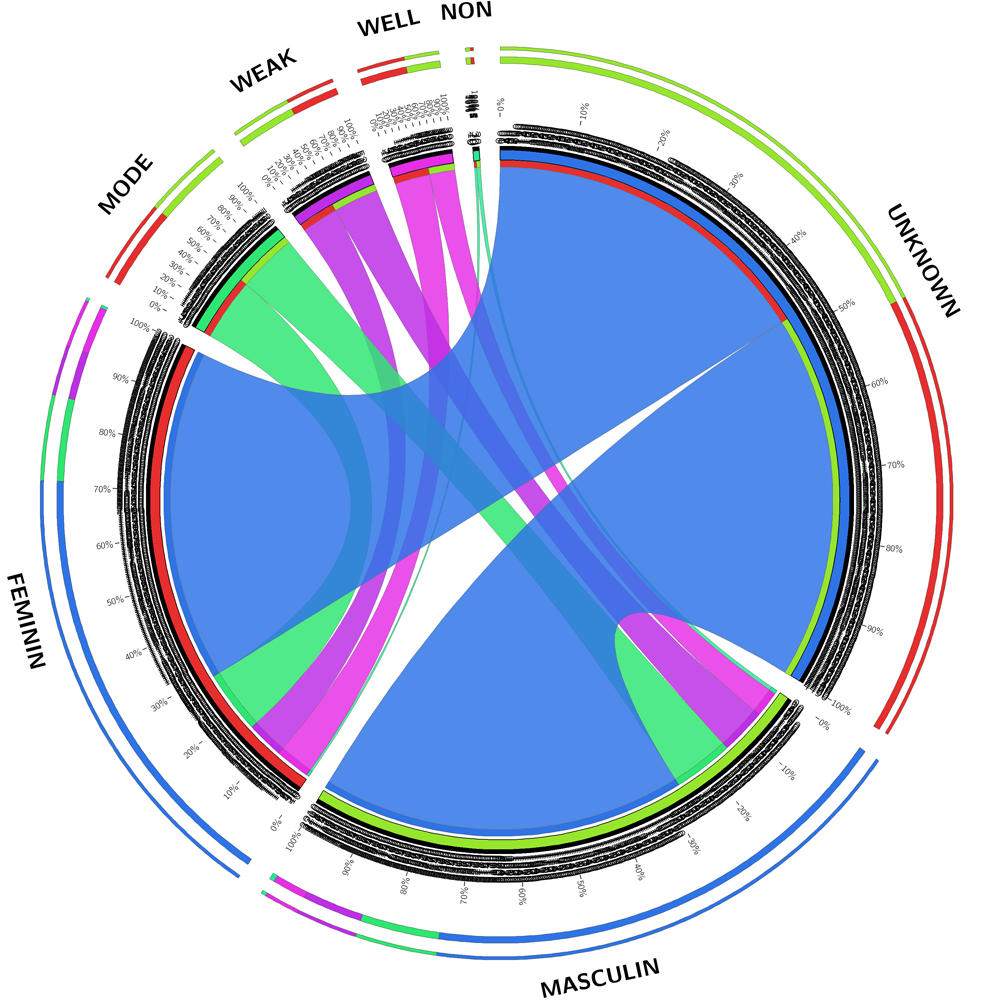
| Fig. 4. Carcinoma map vs metastasis location in a circular layout |
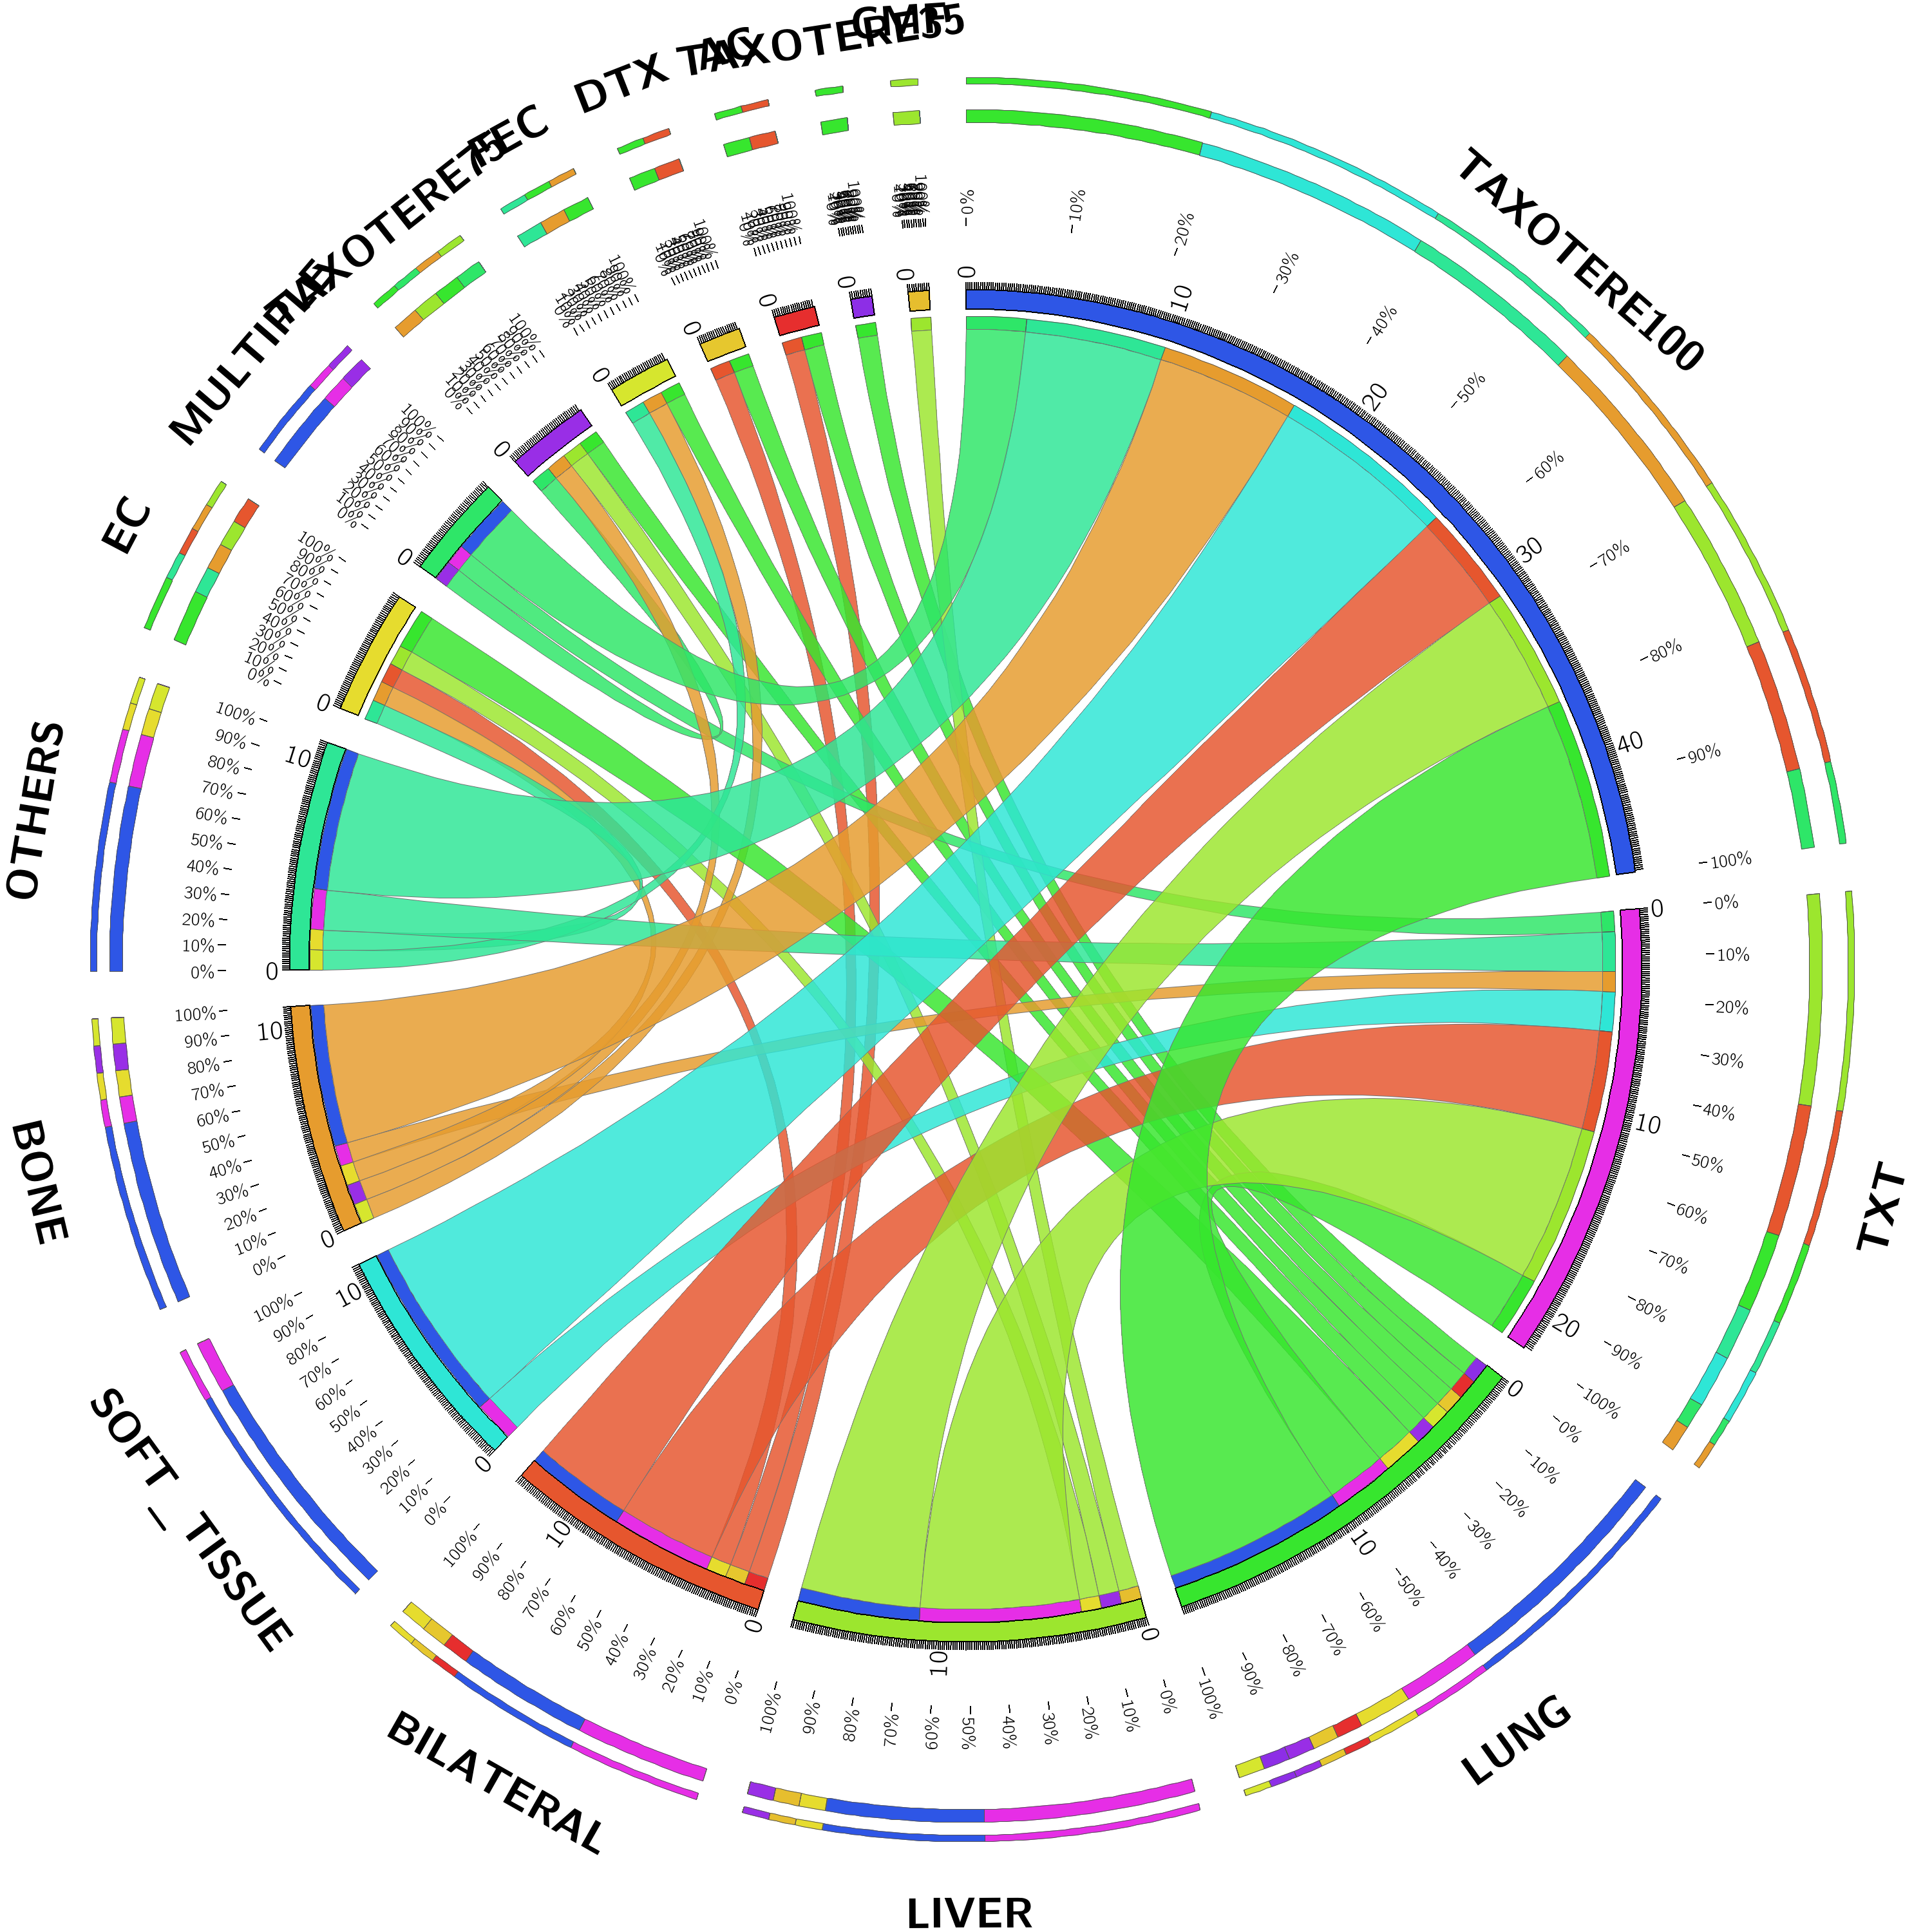 |
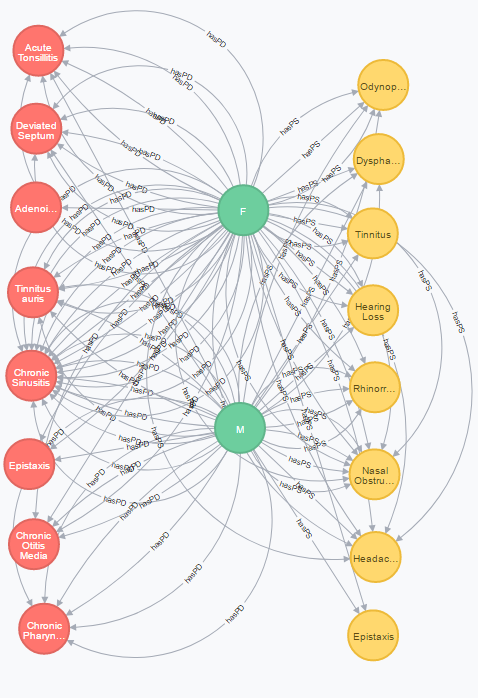
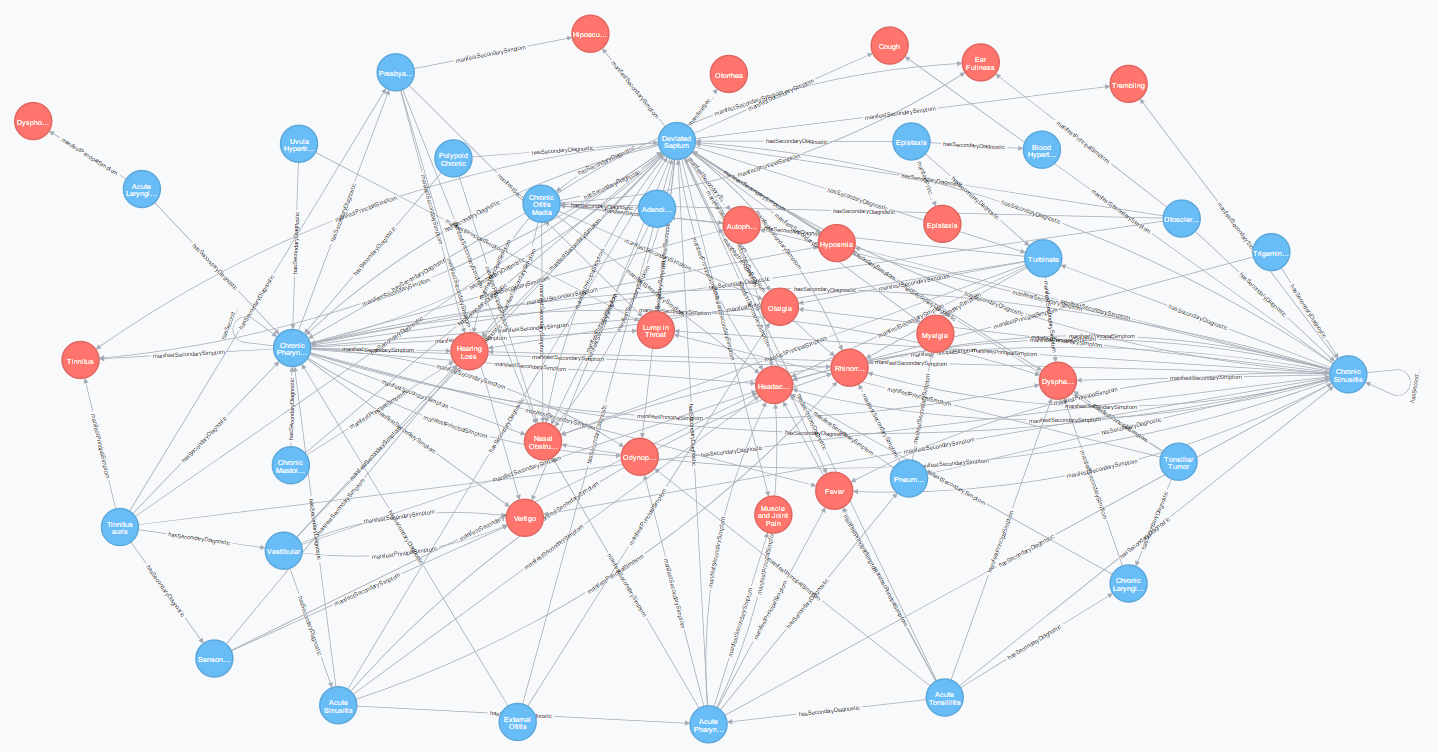
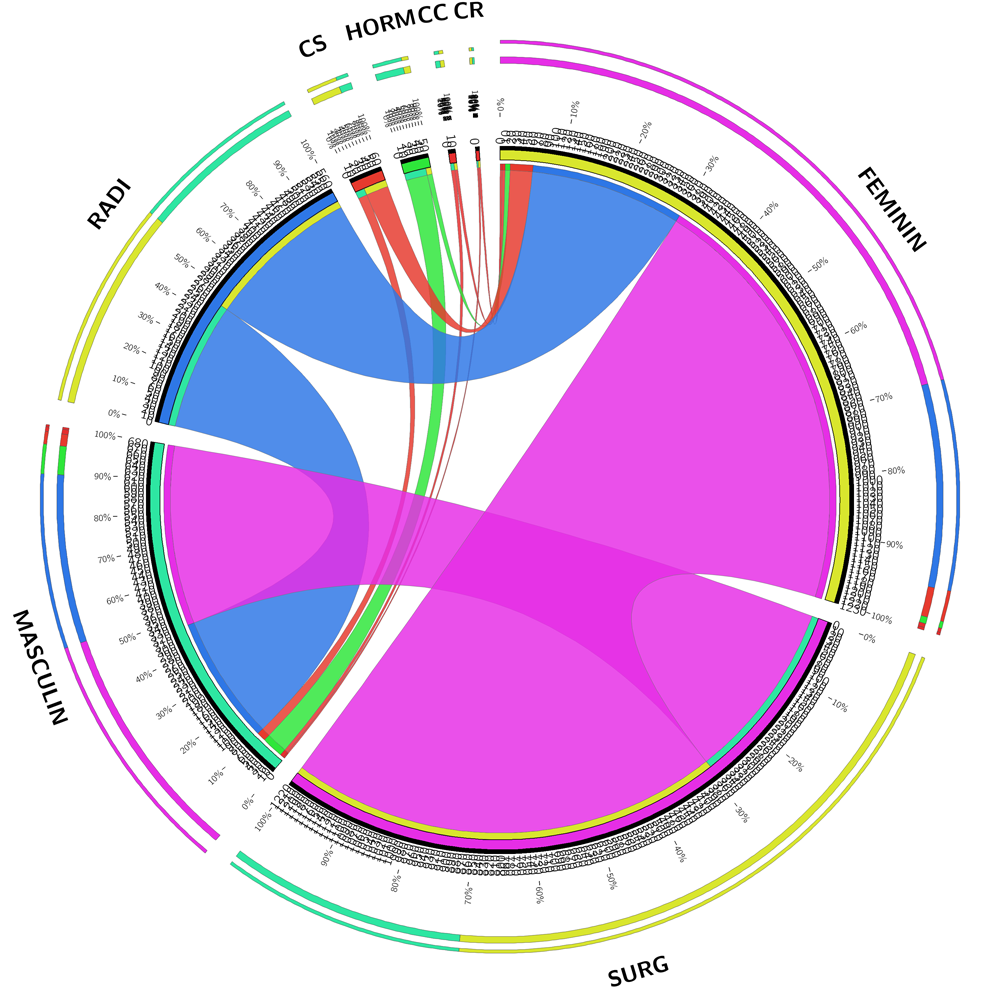
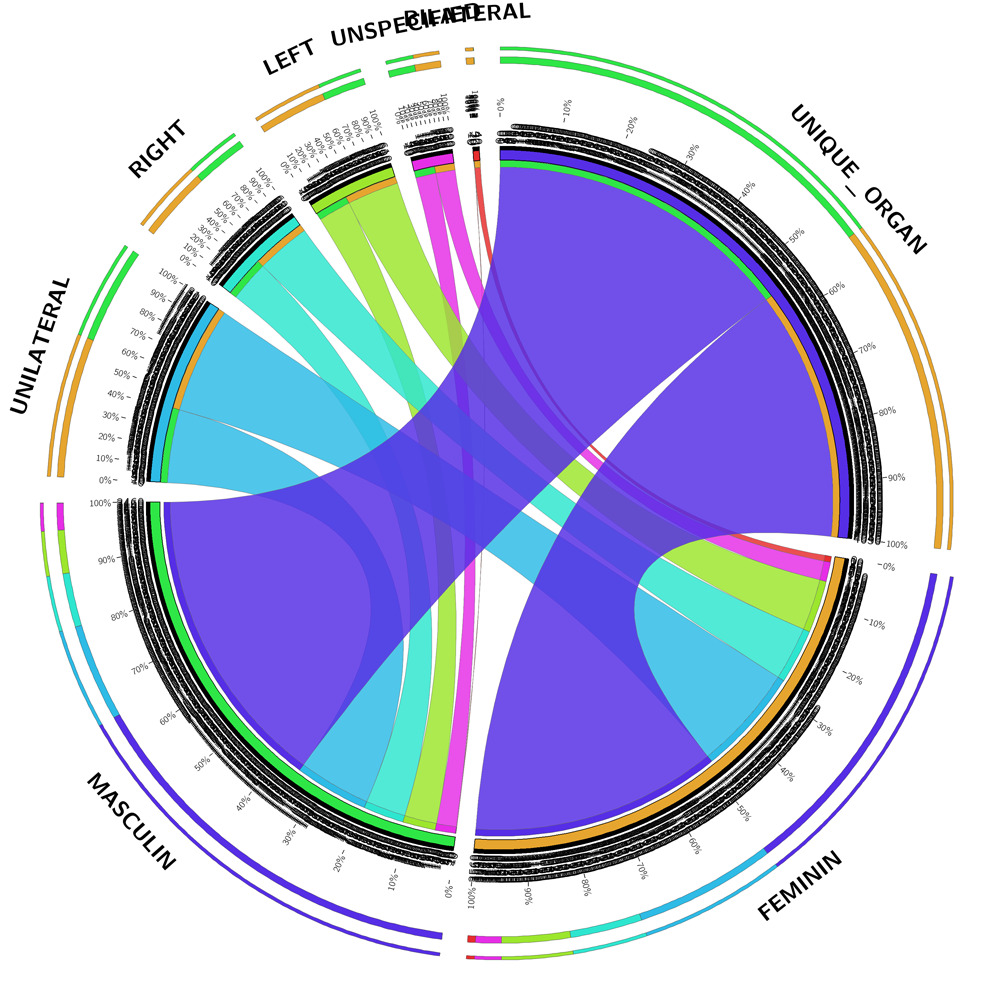
| Fig. 5. Metastasis location vs recommended treatment in a circular layout |
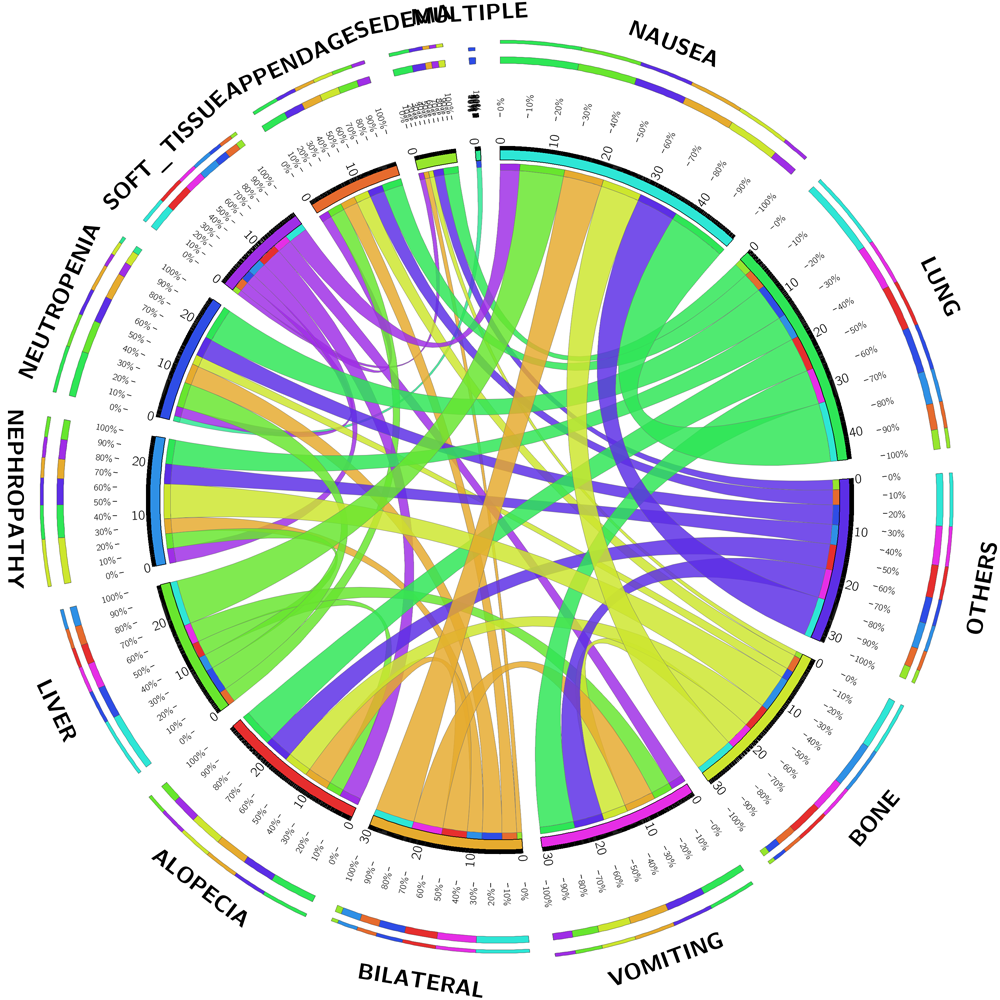 |
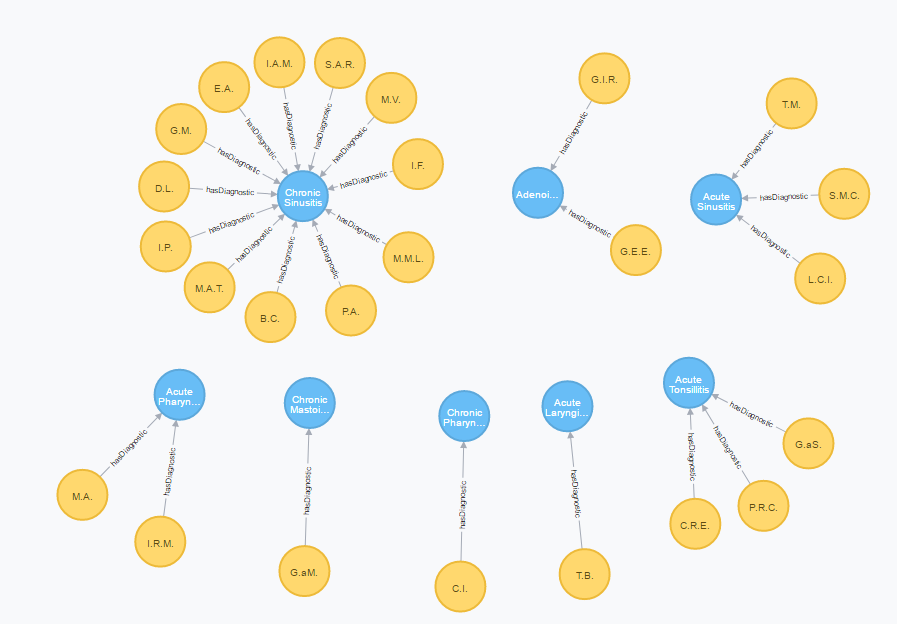
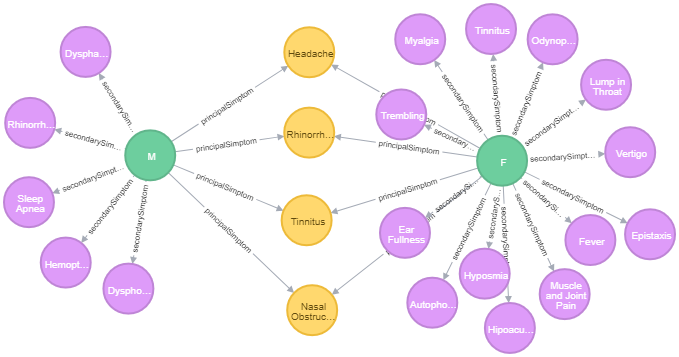
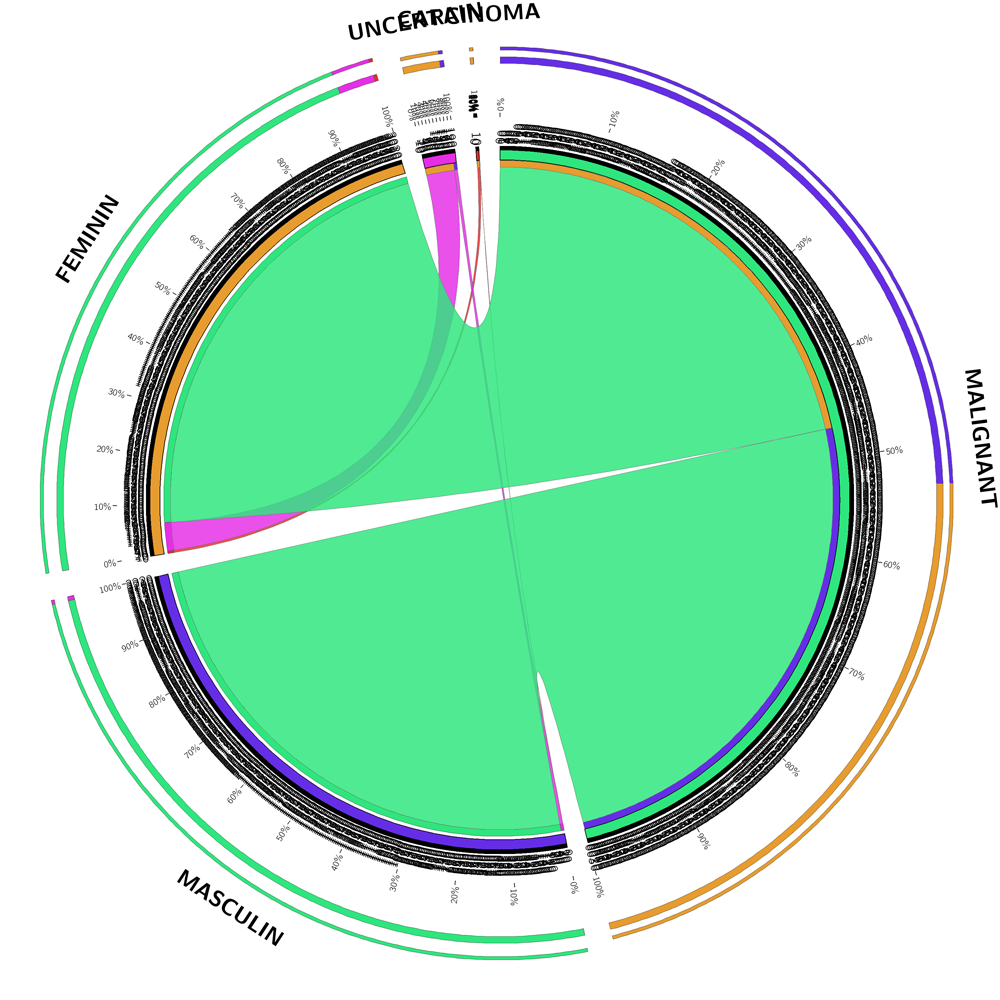
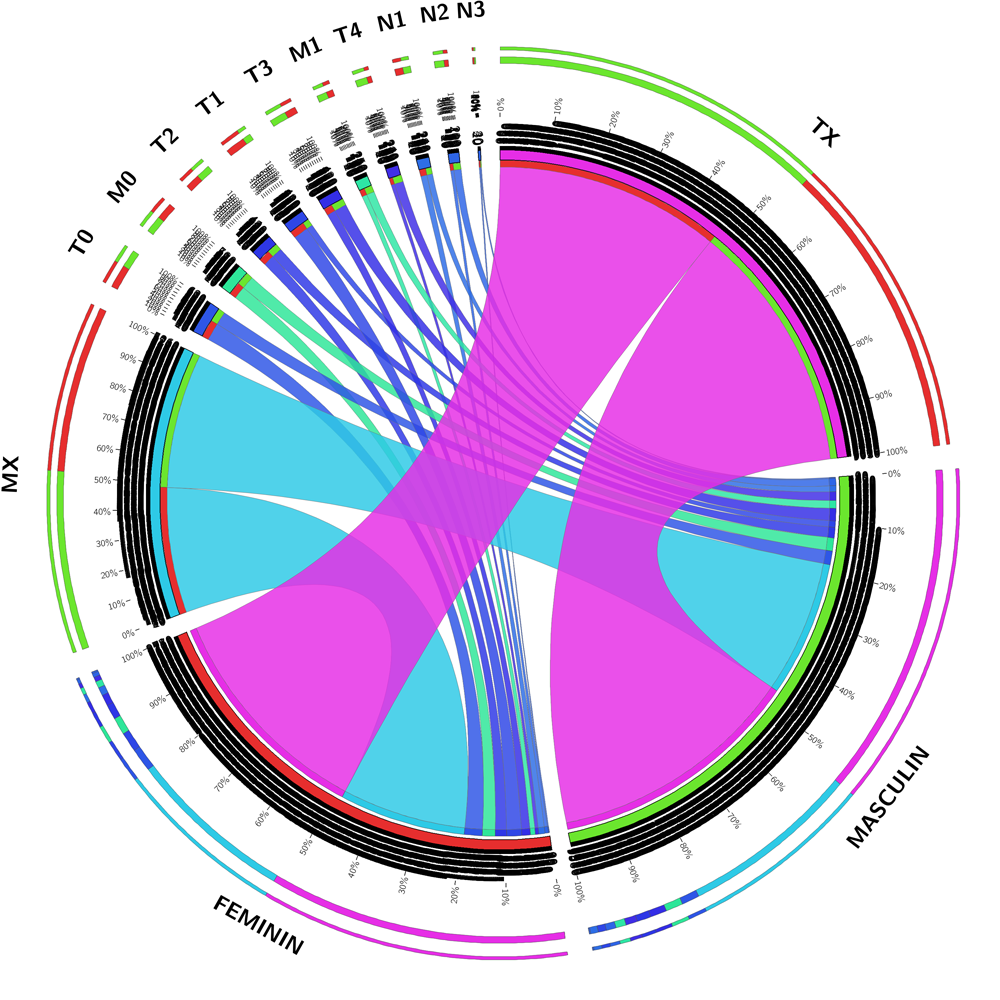
| Fig. 6. Symptoms list vs metastasis location in a circular layout |
 |
| 2016_basis_sex |
 |
| 2016_tumor_sequence_sex |
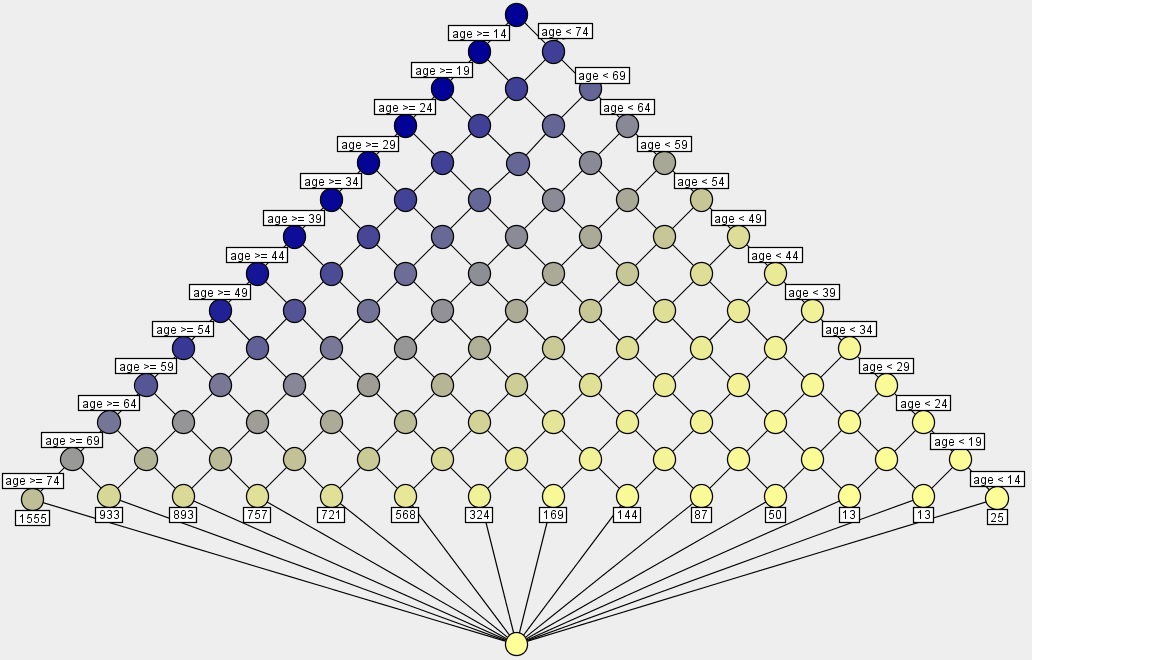 |
| age |
 |
| scala |
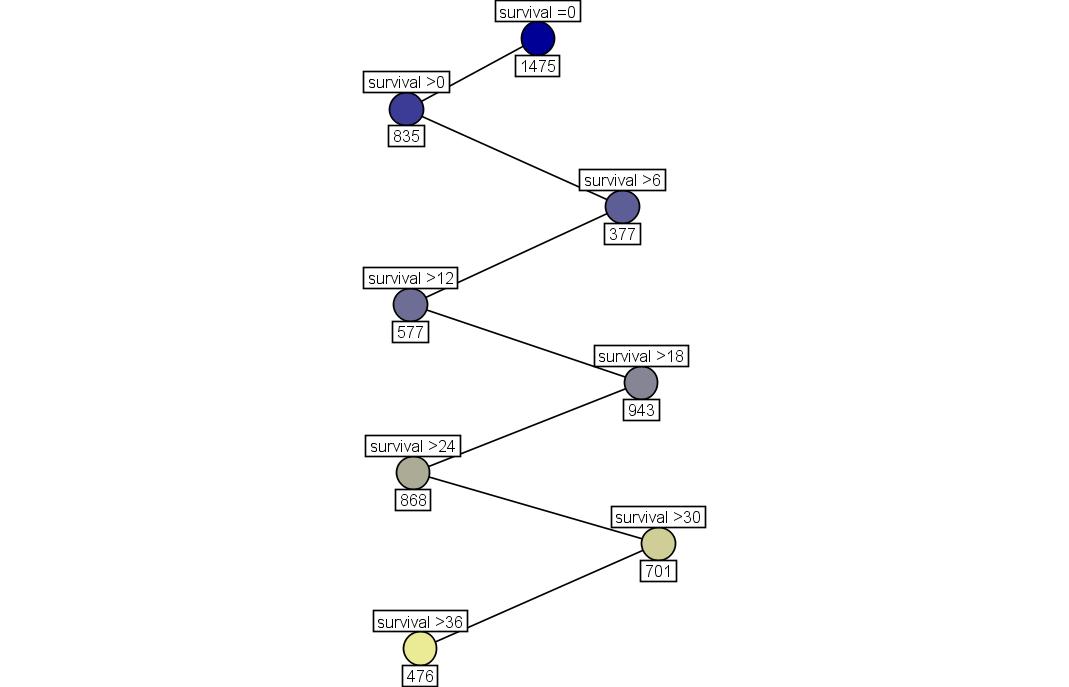 |
| survival |
 |
| topography |
 |
| 2016_vital_sex |
 |
| 2016_tratamente_sex |
 |
| 2016_behavior_sex |
 |
| 2016_condensedTNM_sex |
 |
| 2016_grade_sex |
 |
| 2016_laterality_sex |
|
| Fig. 6. Symptoms list vs metastasis location in a circular layout |
 |
| 2016_TNM_sex |
—
 |
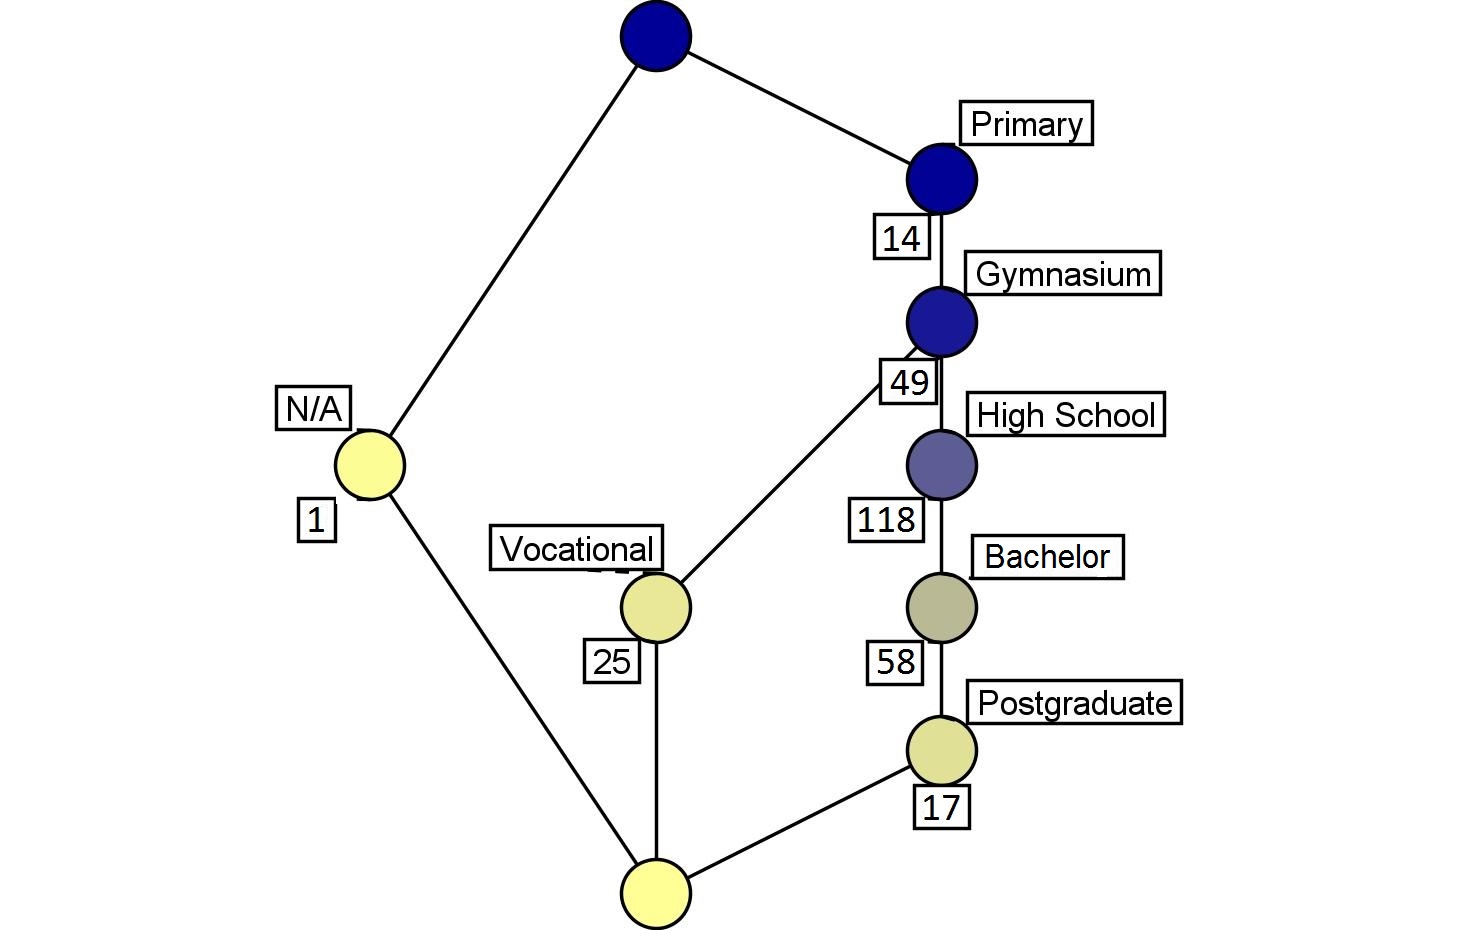 |
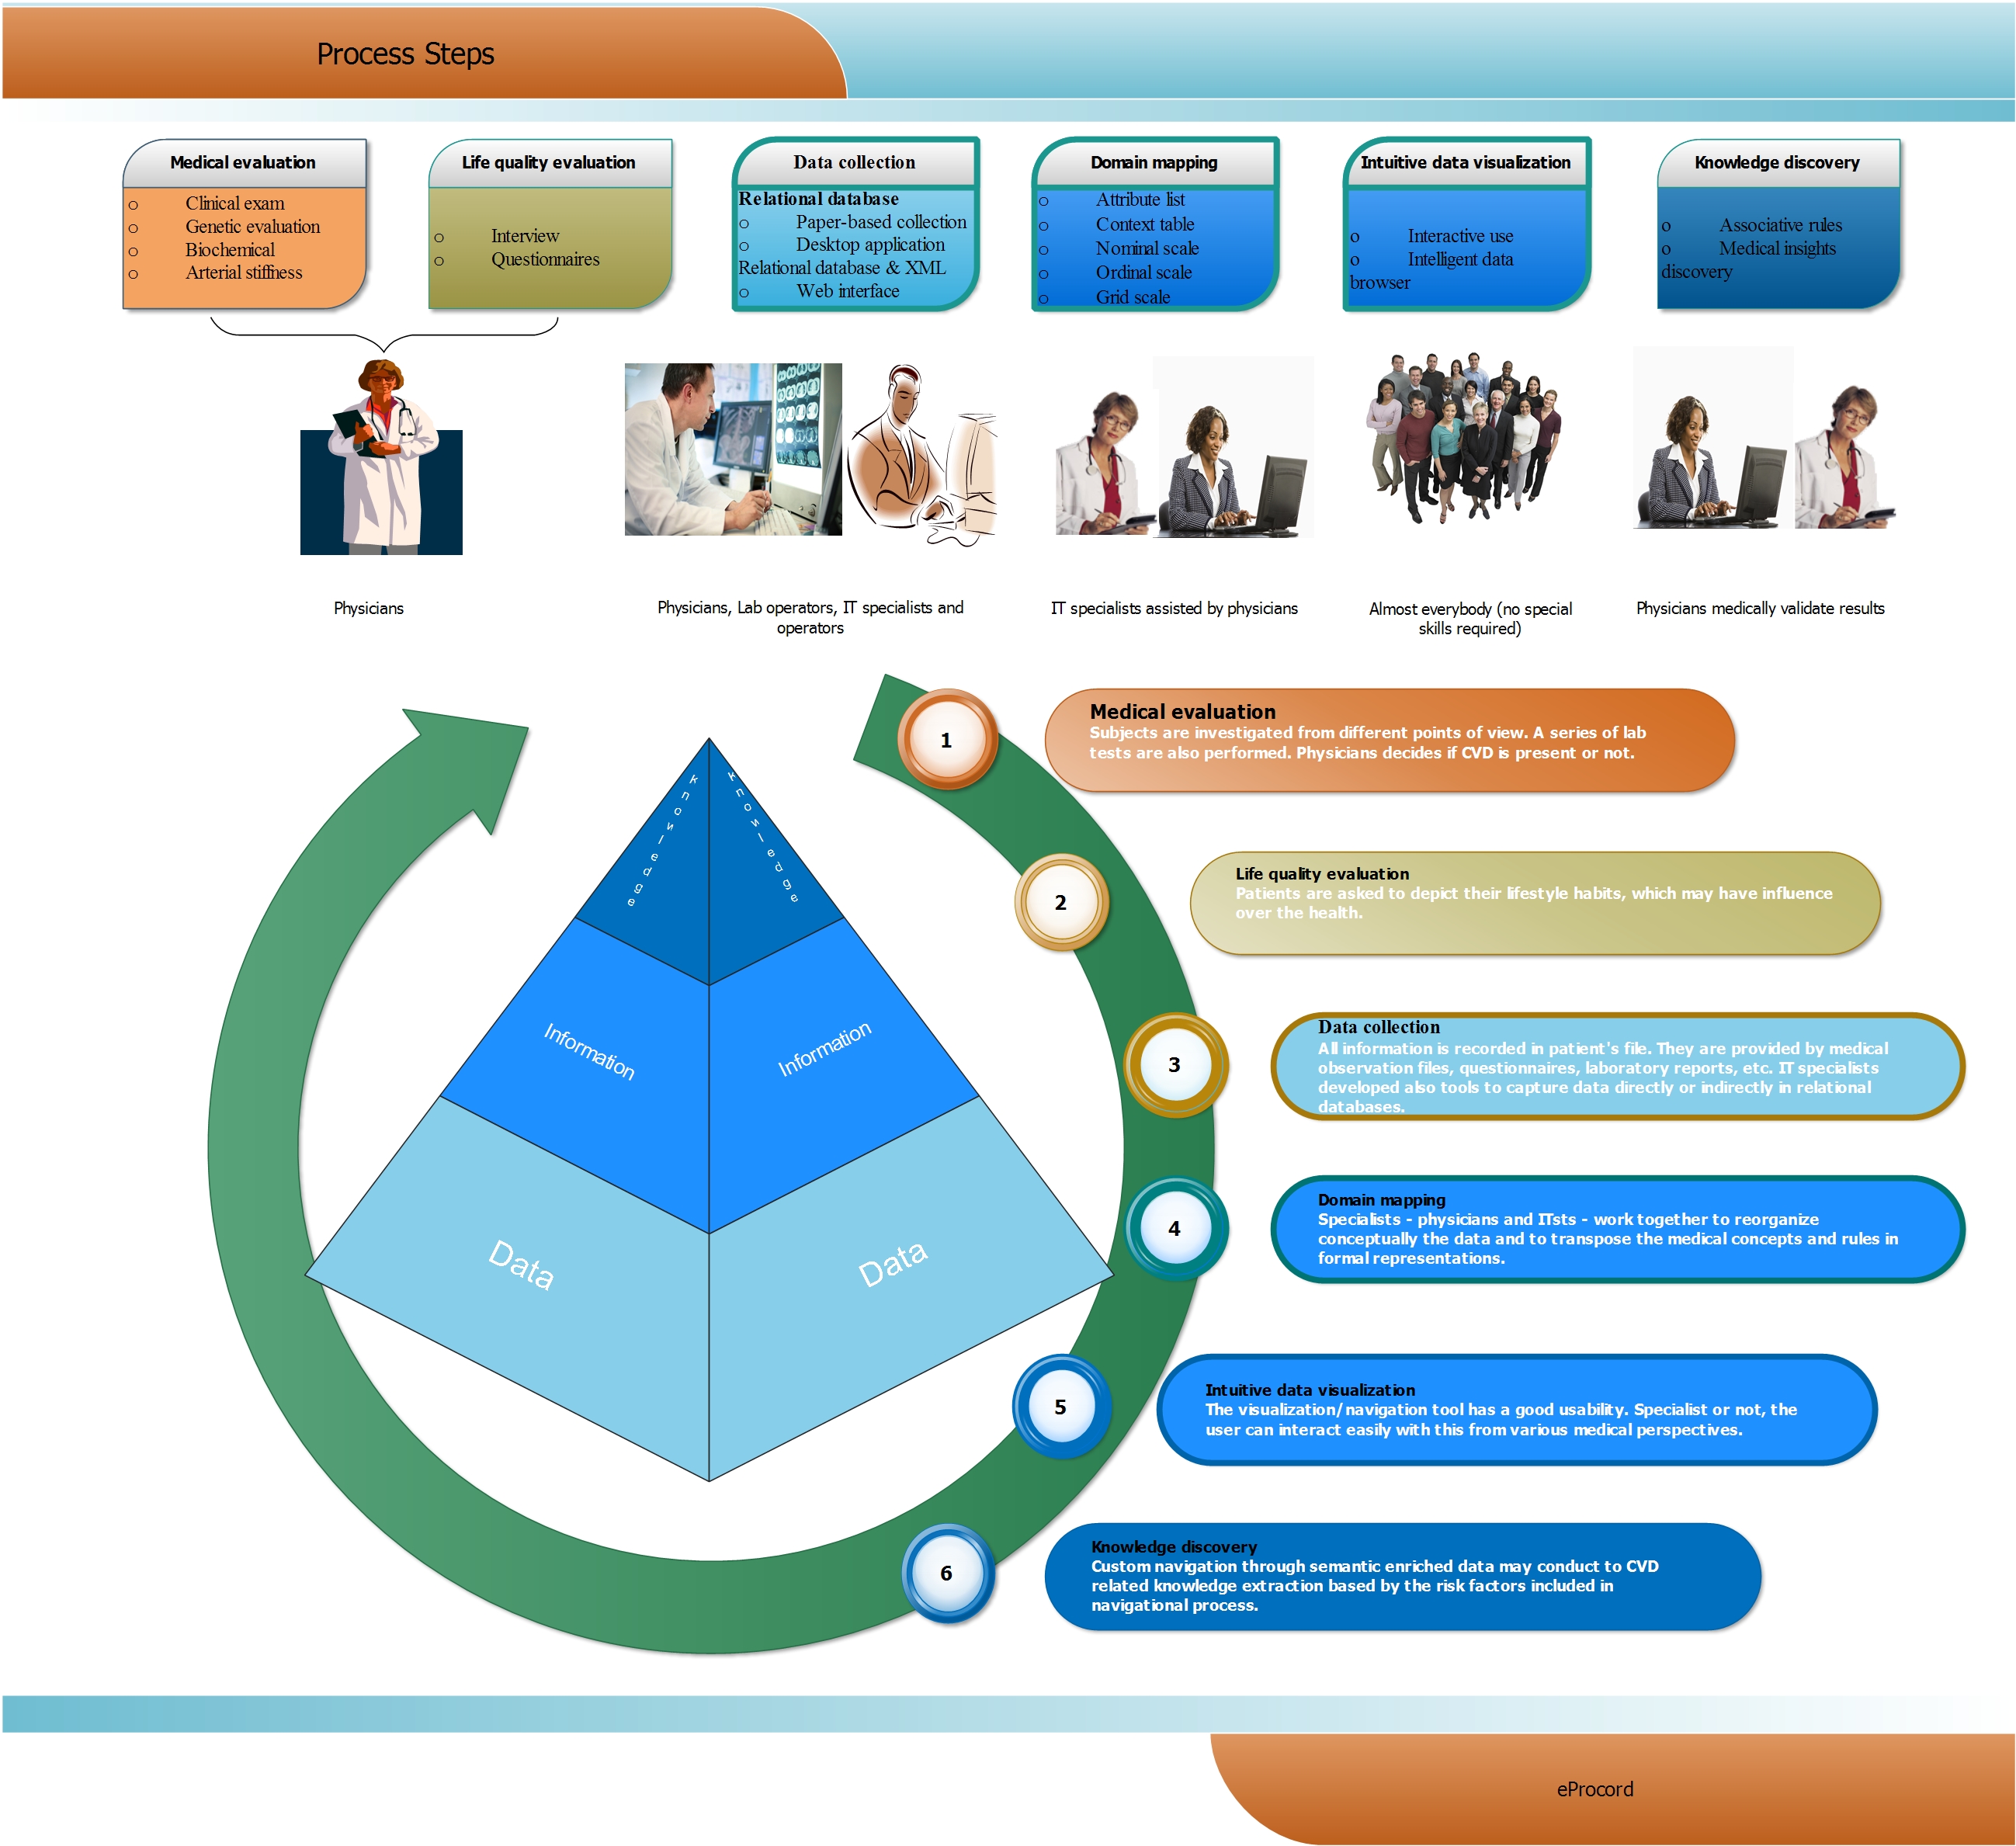
| eProCords project structure | Educational trajectory of patients |
|---|---|
 |
 |
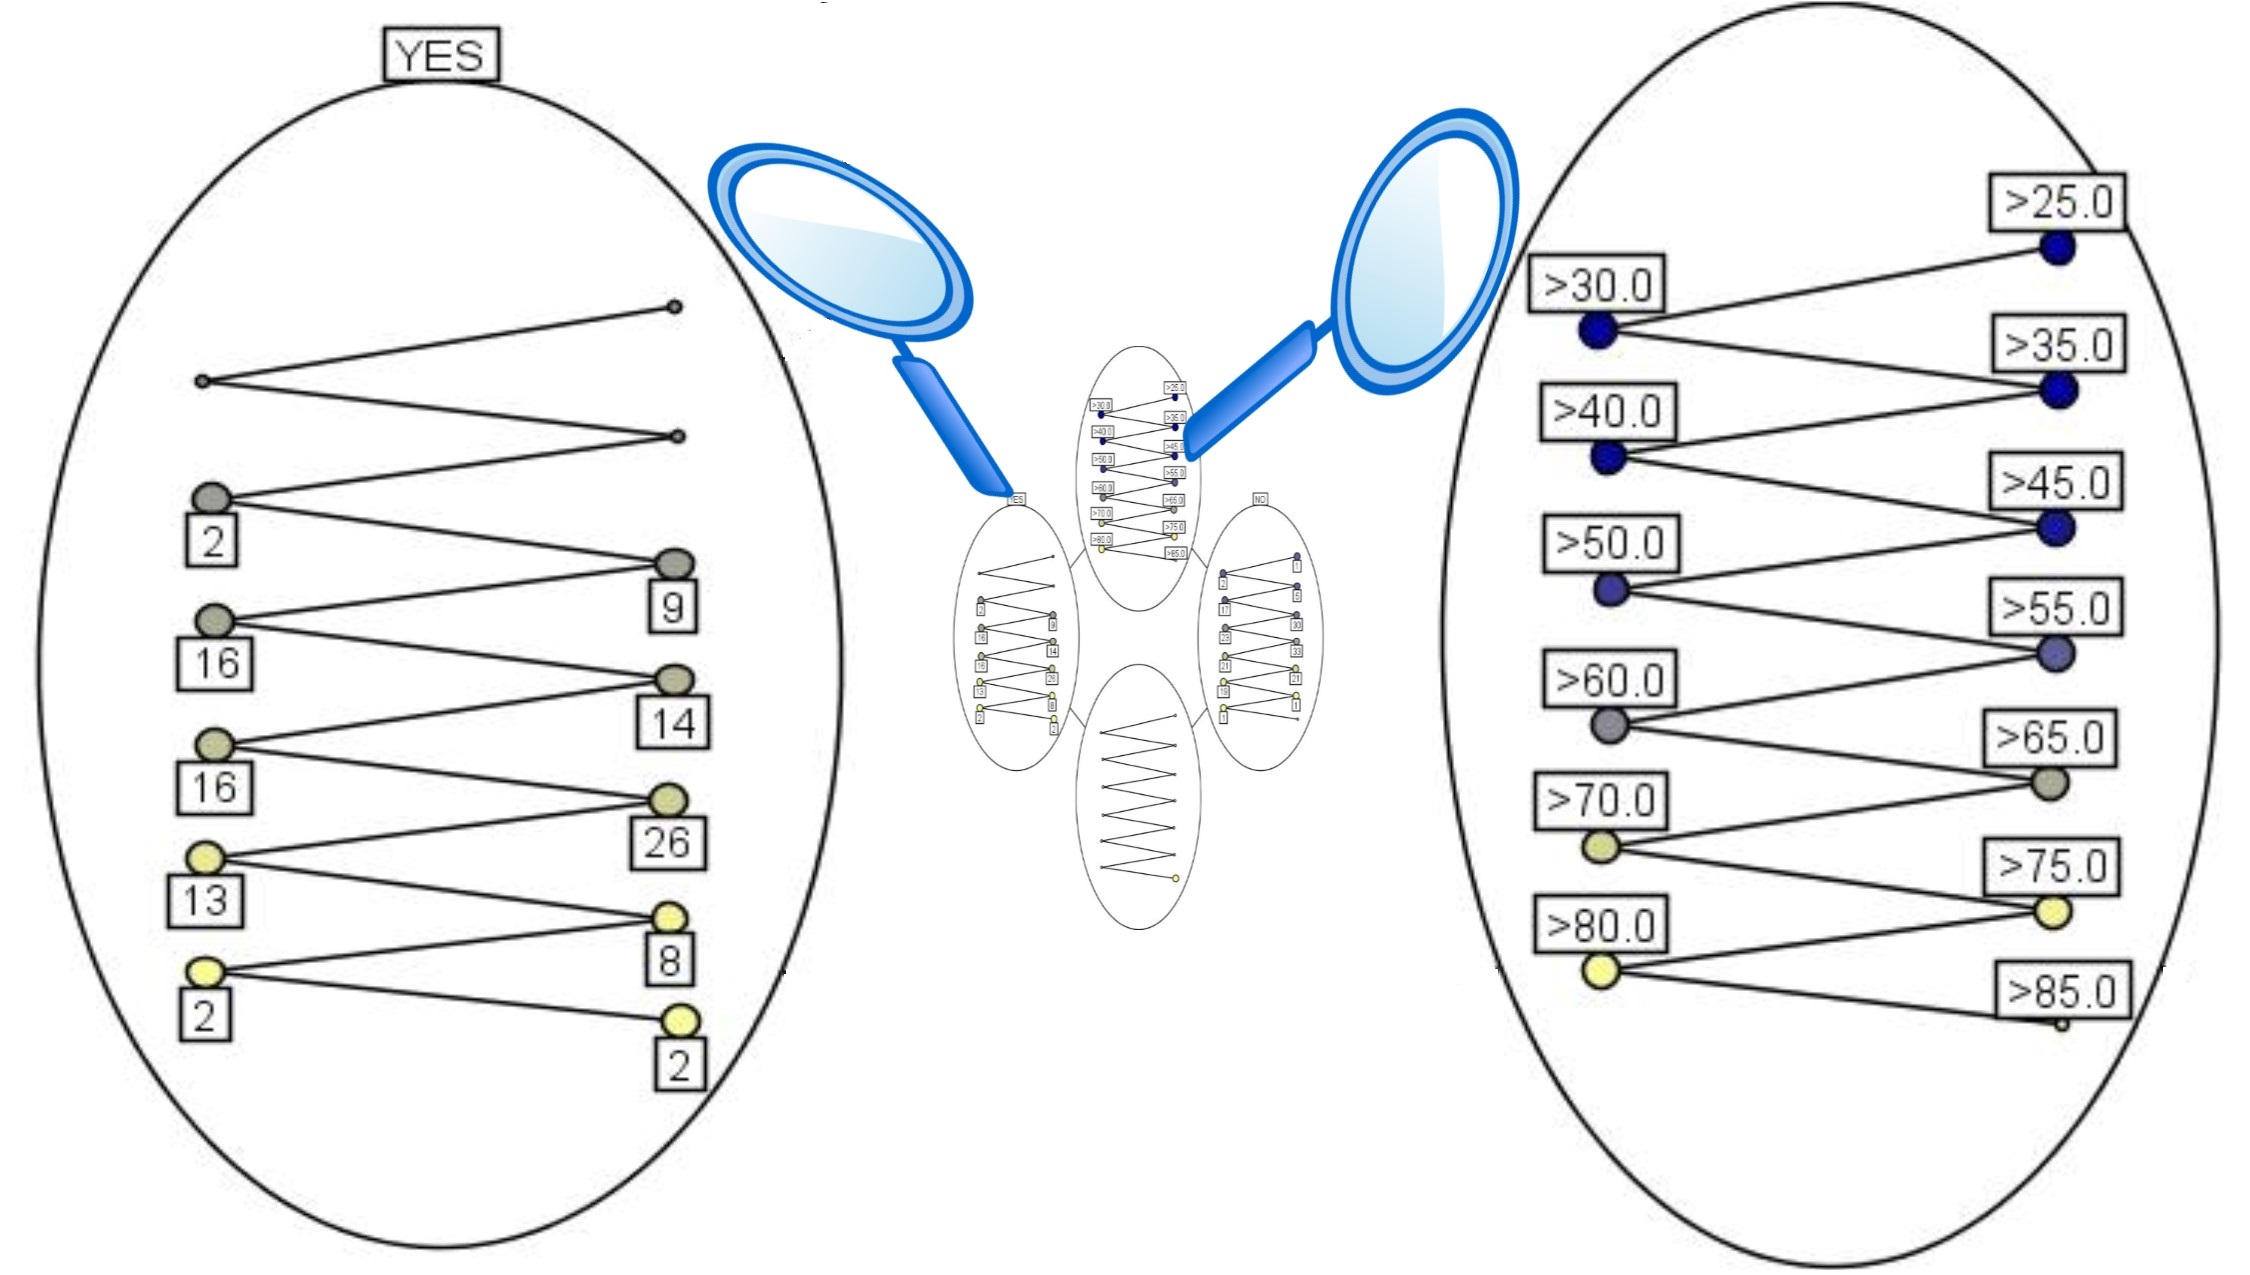
| Occurence of CVD diseases over age intervals | Occurence of CVD diseases over age intervals |
 |
 |
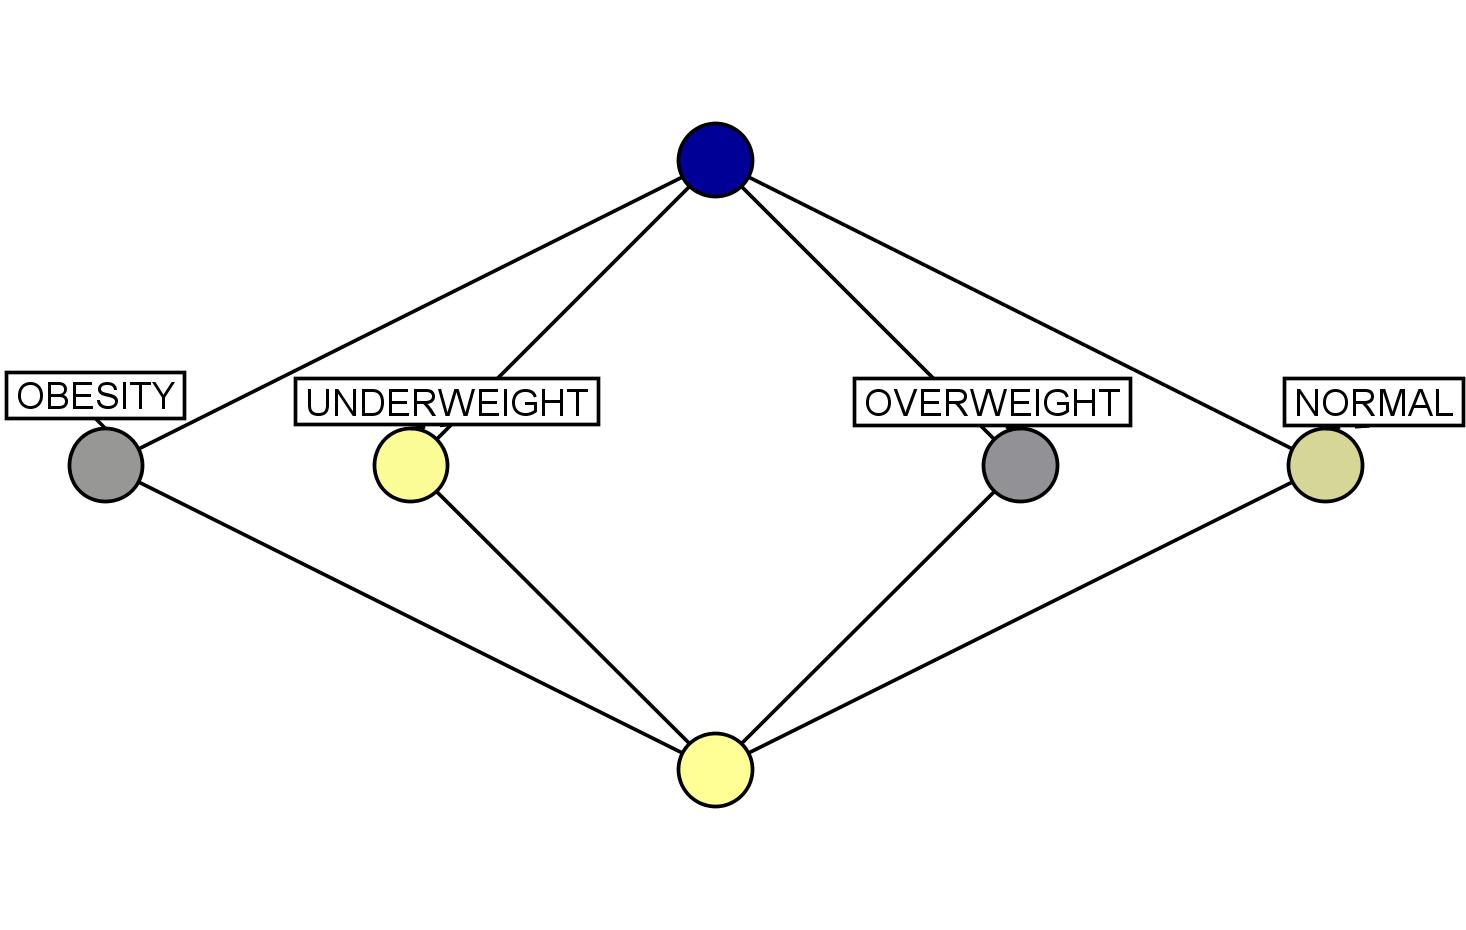
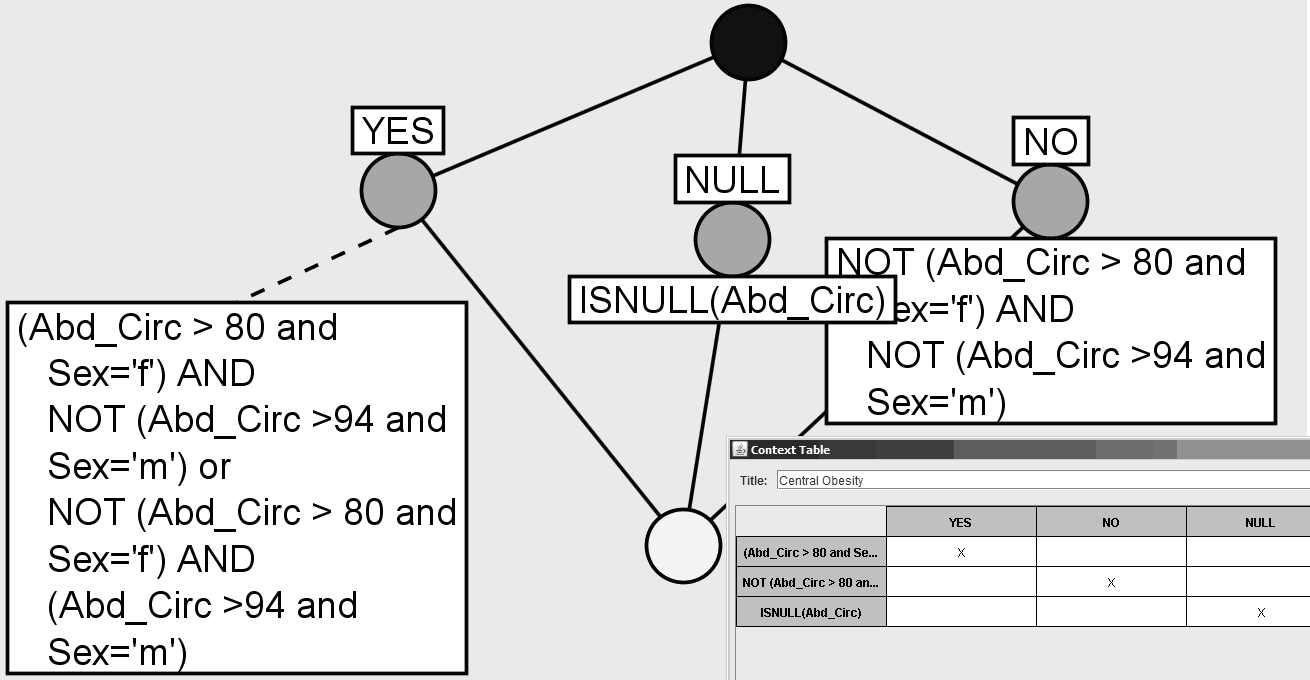
| Obesity scale | Combined scaling of the many-valued attributes Gender and Abdominal Circumference. |
 |
 |
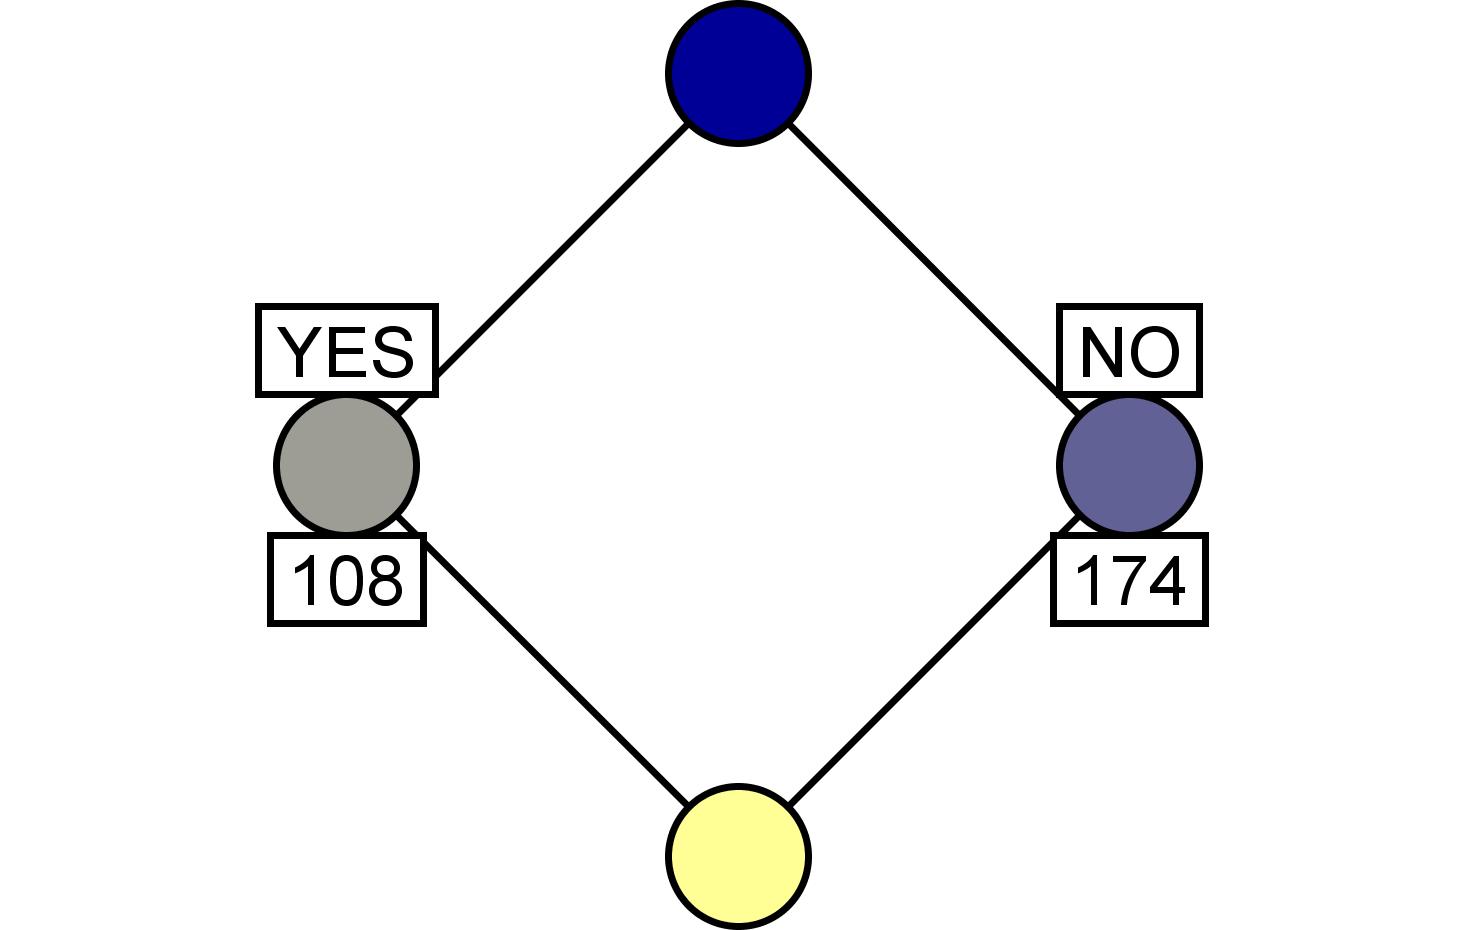
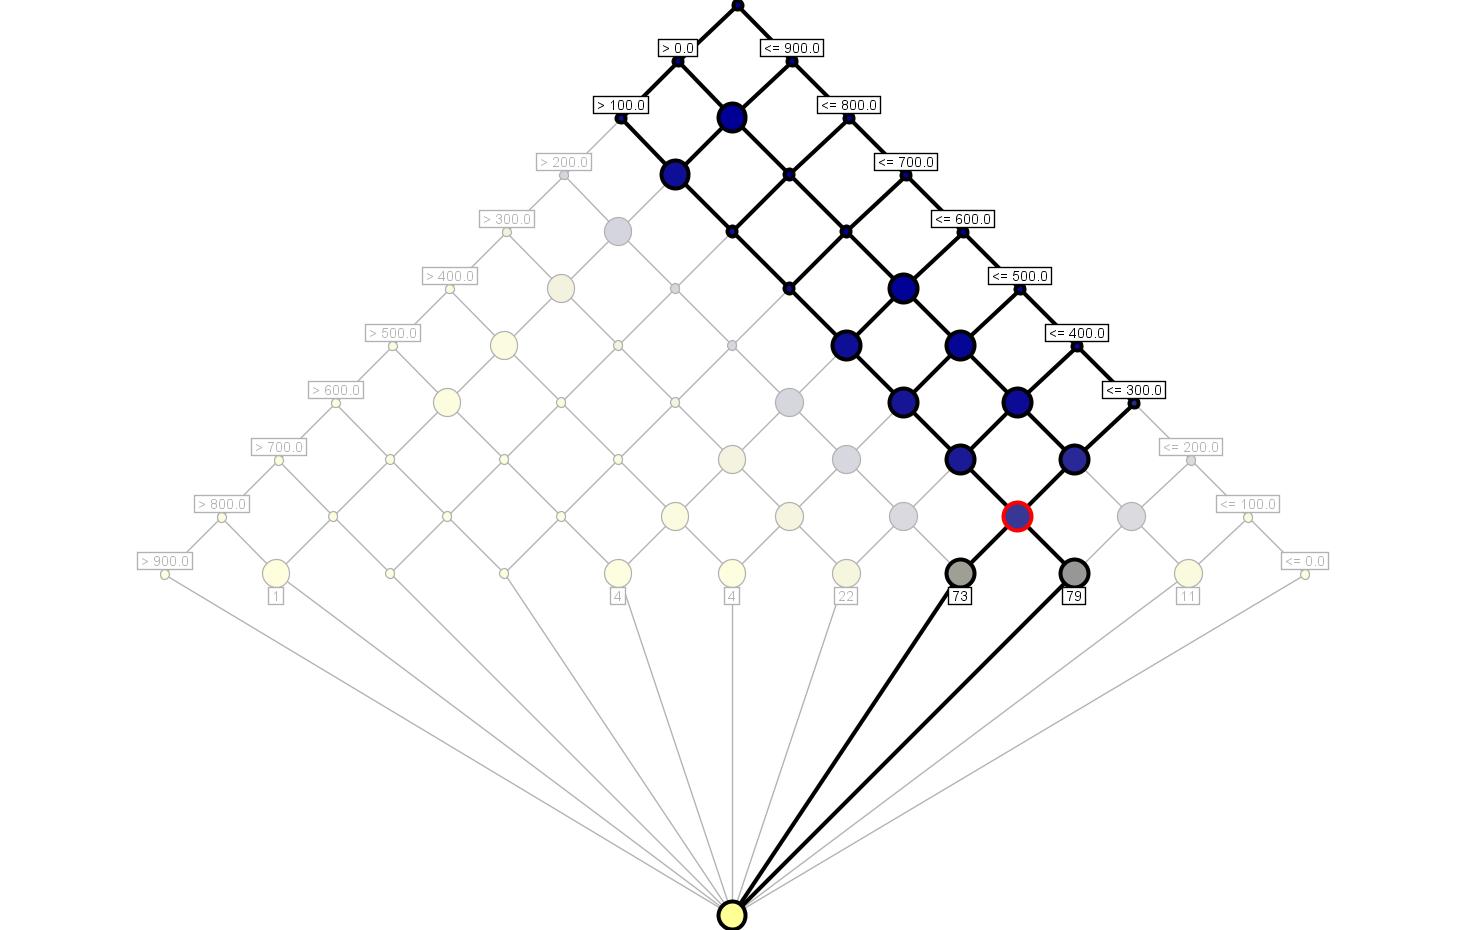
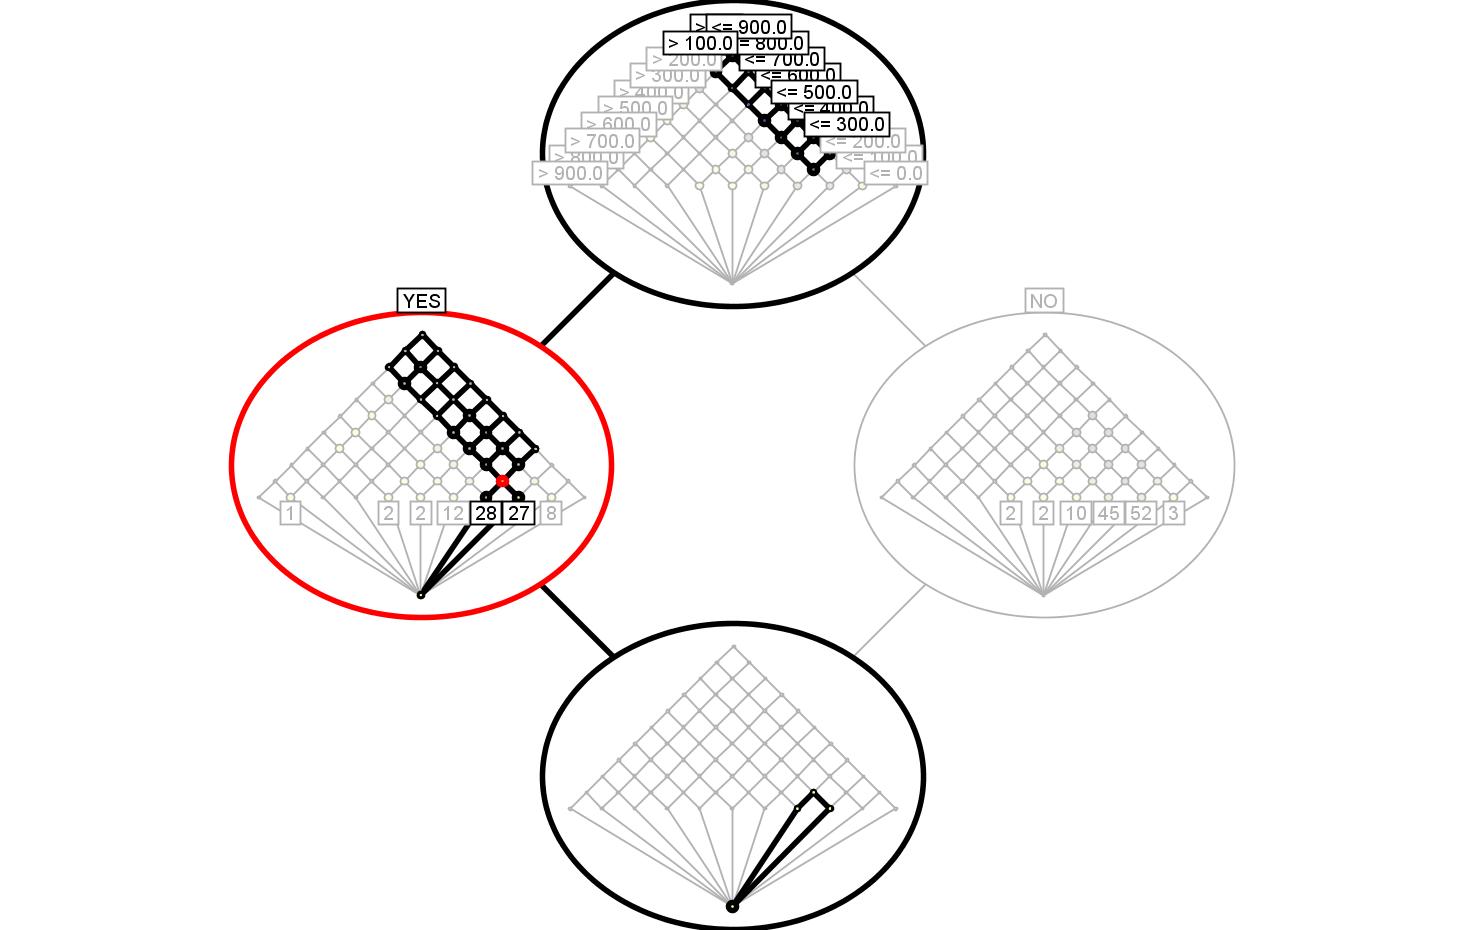
| Dichotomic scale of cardiovascular disease occurence | Number of subjects having ICAM values between 100 and 300 |
 |
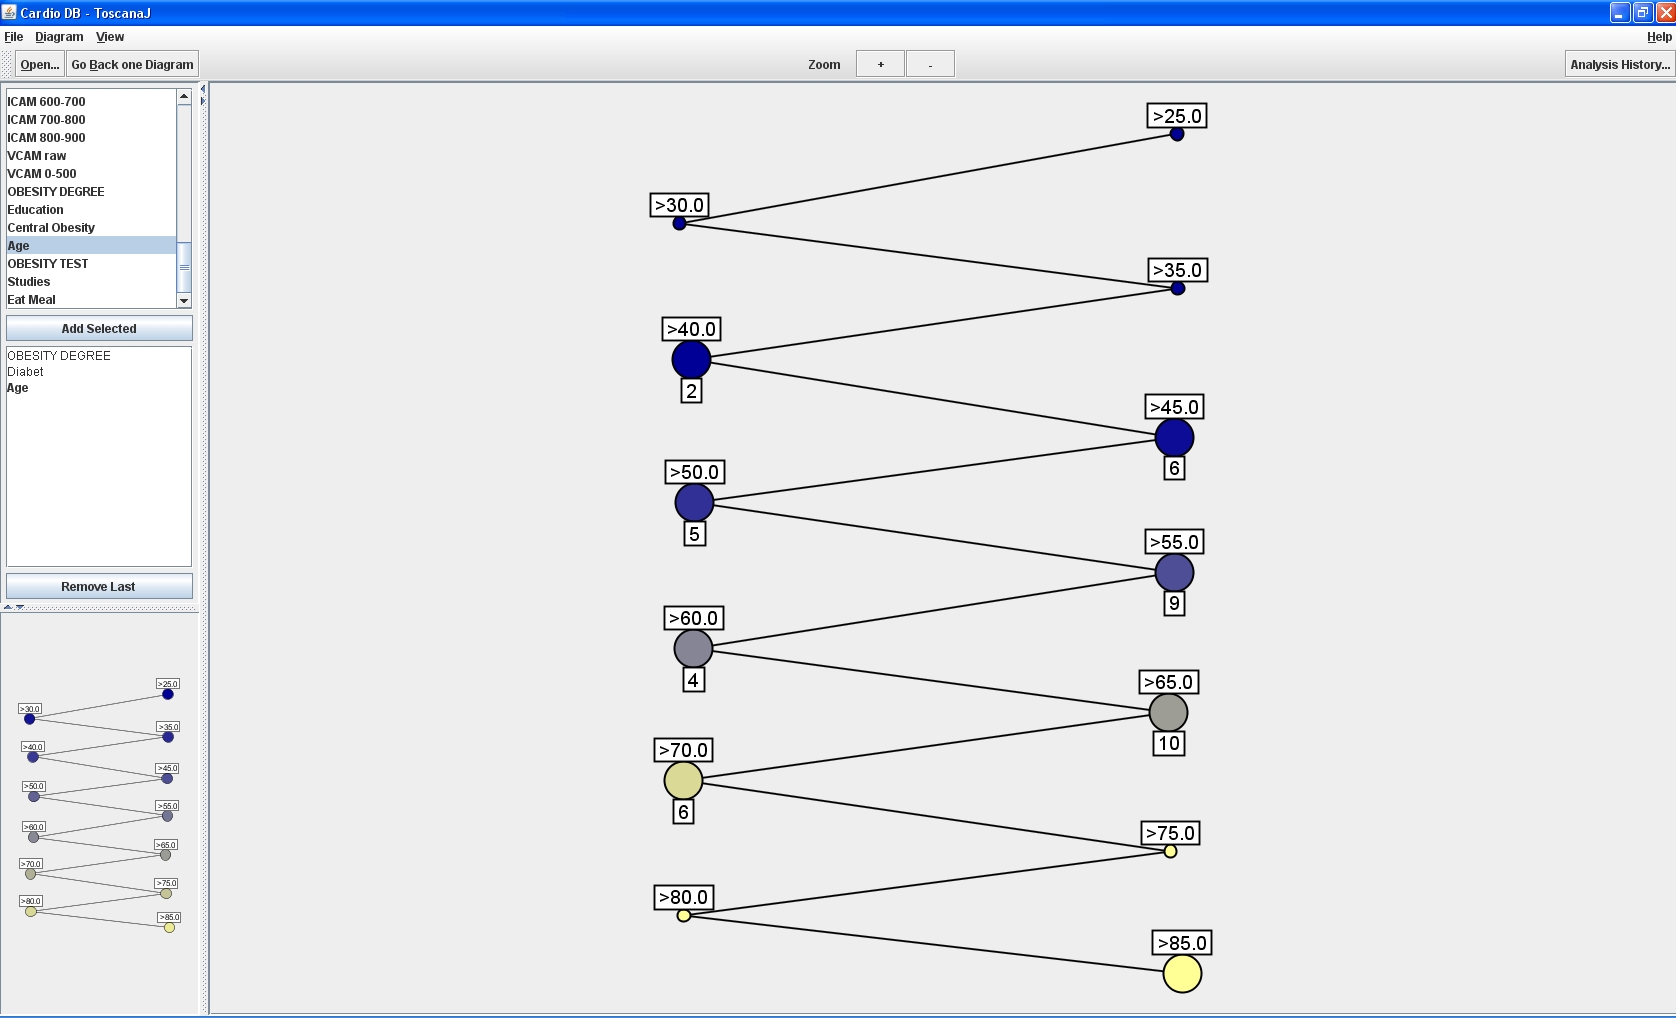 |
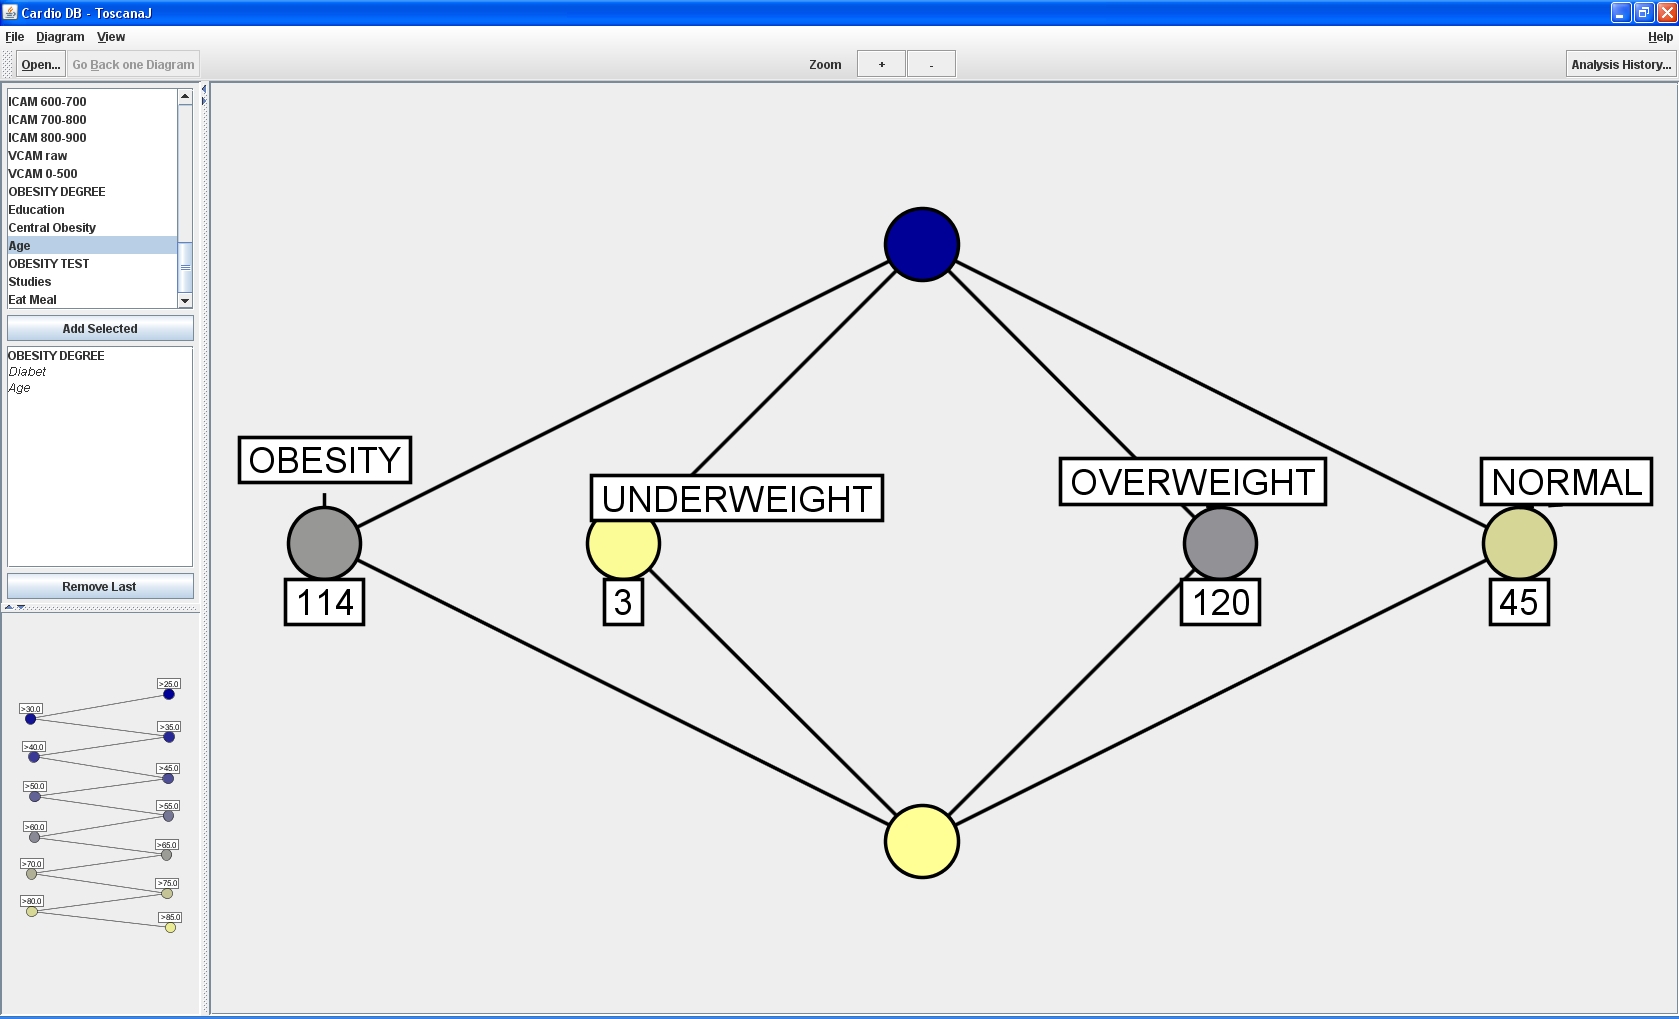
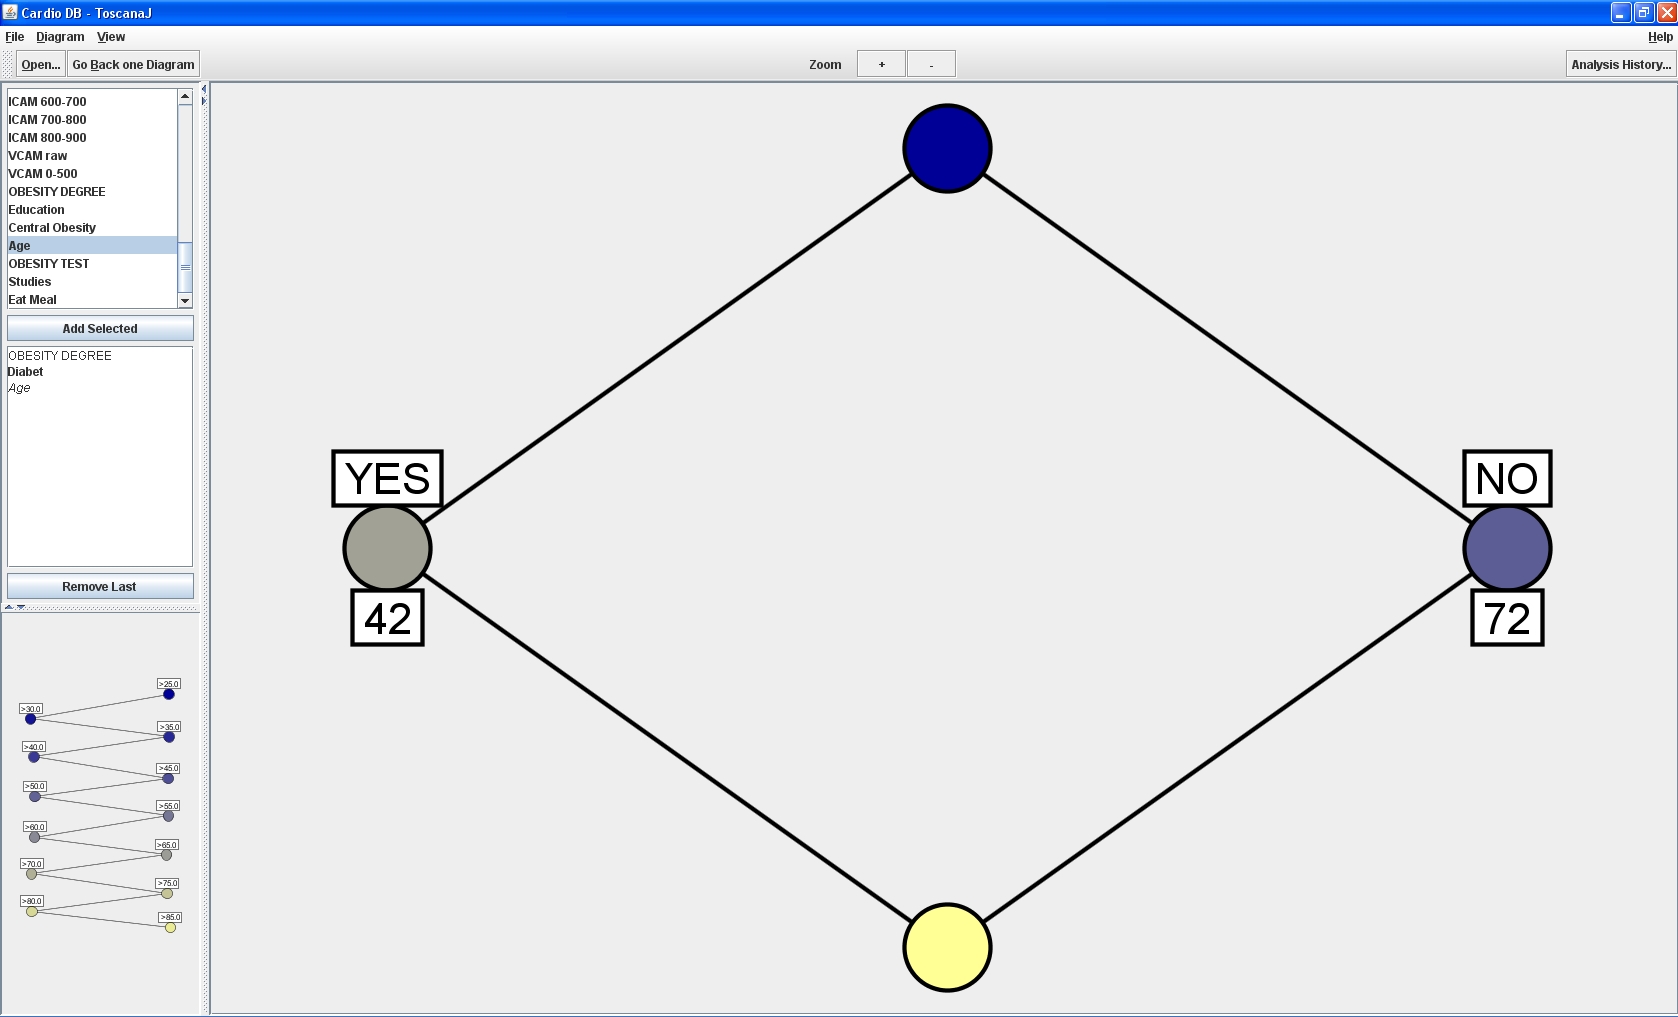
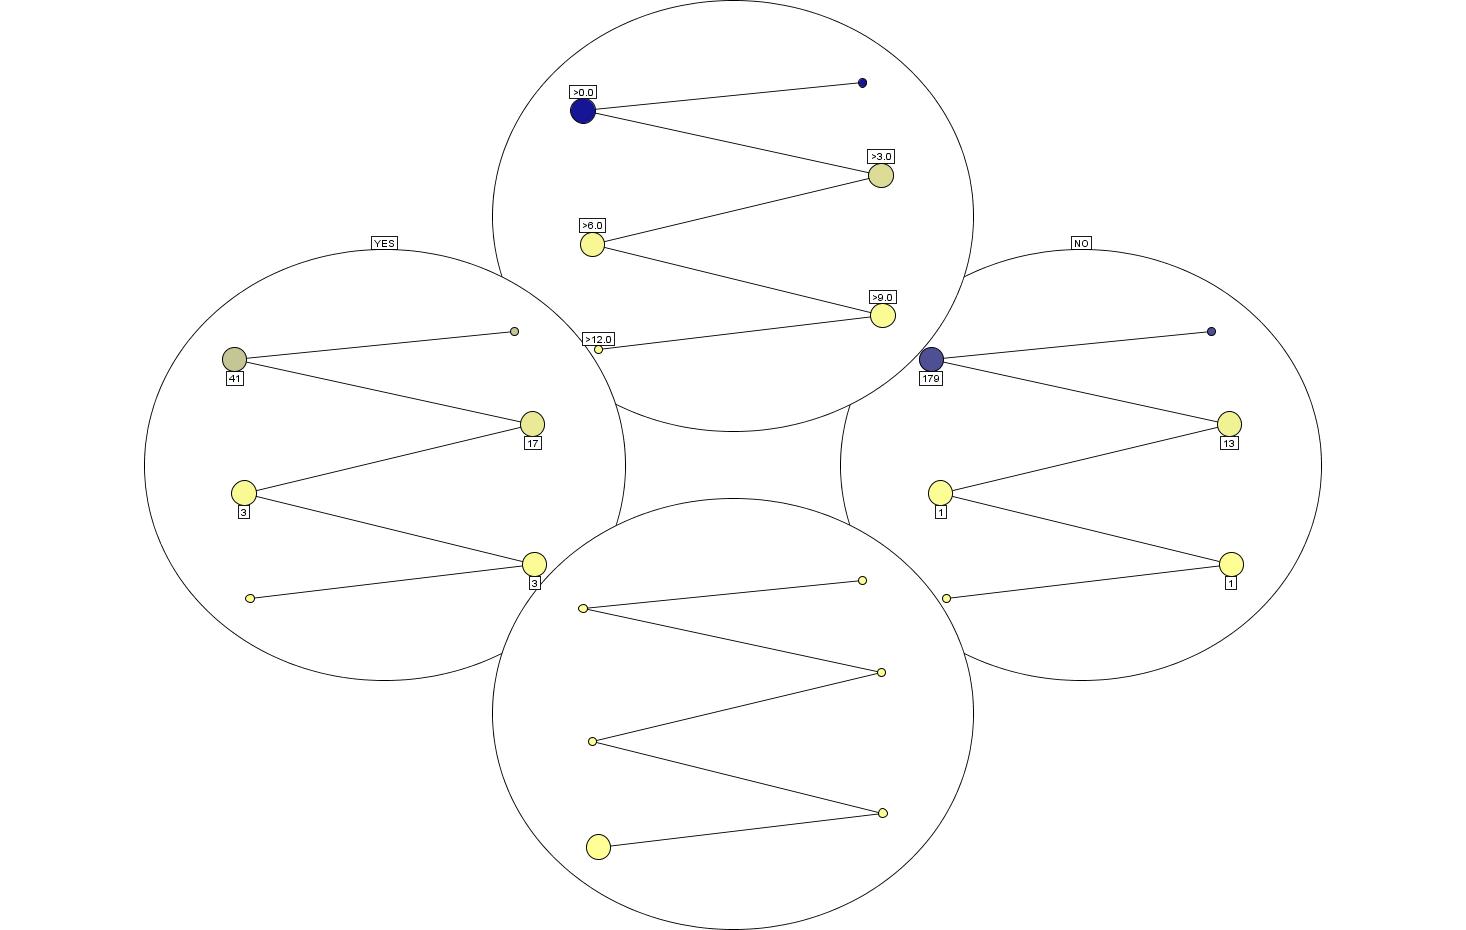
| ToscanaJ browsing scenarios: Obesity-Diabetes-Age | ToscanaJ browsing scenarios: Obesity-Diabetes-Age; zooming into the Obesity node |
 |
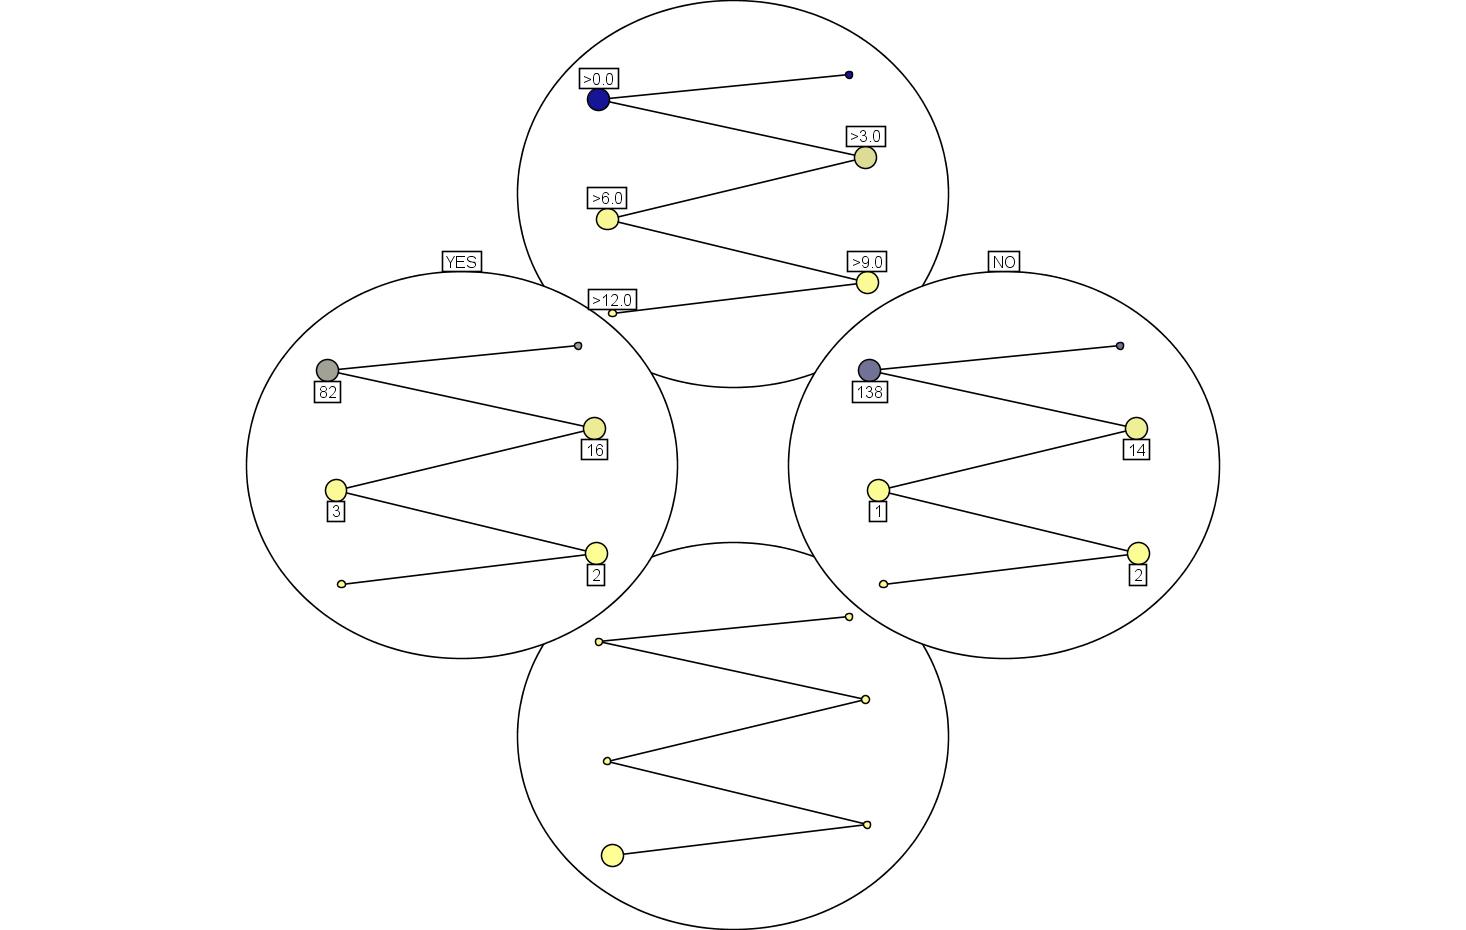 |
| Correlation Obesity – Diabetes mellitus – Age conceptual map | Correlation Diabetes mellitus – HOMA values nested conceptual map |
 |
|
| Correlation CVD – HOMA values nested conceptual map. |